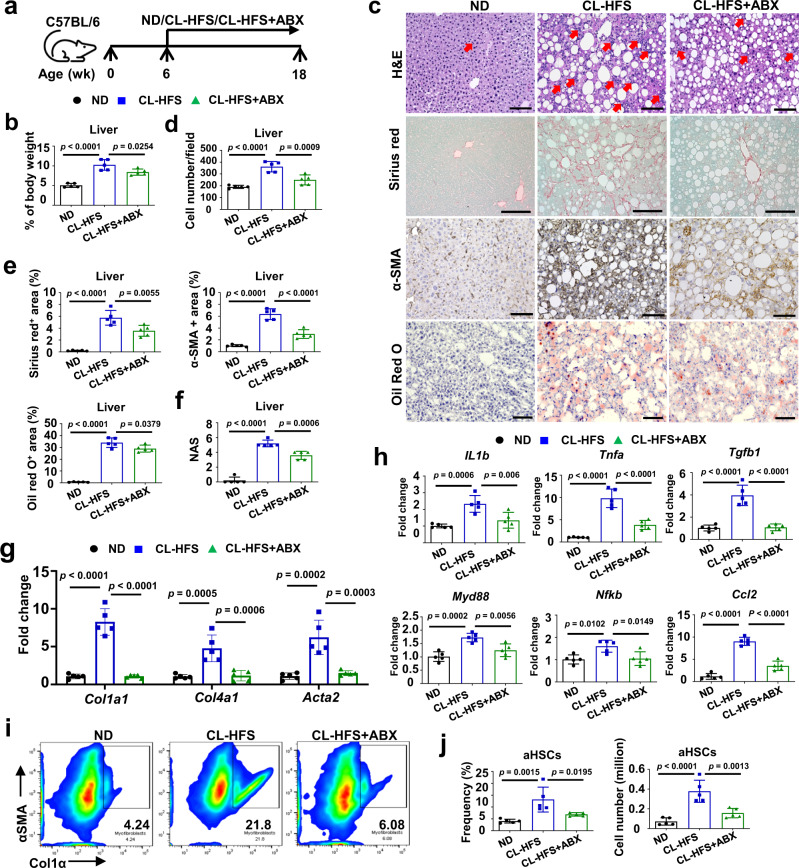
Fig. 2. ABX treatment slows the development of CL-HFS-induced NASH.
a An outline depicting ABX treatment design. Six-week-old WT C57BL/6 J mice were fed with a CL-HFS for 12 weeks with or without simultaneous ABX treatment, then euthanized for the following studies. ND-fed mice were used for controls. b Effect of ABX on CL-HFS-induced increase in the ratios of liver-to-bodyweight. Compared to ND, CL-HFS caused an increase in the liver-to-bodyweight ratio which was suppressed by ABX treatment. c Effect of ABX on CL-HFS-induced NASH. Compared to untreated mice, ABX treatment led to an obvious reduction in the liver infiltration of inflammatory cells (red arrow) (H&E staining), production of collagen (Sirius red staining), α-SMA (IHC detection), and lipid accumulation (Oil red O staining) in CL-HFS-fed mice. Bar: 100 μm. d Semi-quantification of inflammatory cells infiltratiing into the liver; e Semi-quantification of collagen production, α-SMA protein expression, and lipid accumulation in the livers of three groups of mice shown in c. f NAFLD activity score (NAS). ABX treatment led to reduced NAS in CL-HFS-fed mice. g Hepatic mRNA expression of ECM genes in CL-HFS-fed mice with or without ABX treatment. qPCR measured reduced mRNA expression of Col1a1, Col4a1, and Acta2 in the livers of ABX-treated mice compared to untreated mice. h Hepatic mRNA expression of proinflammatory cytokines, profibrotic cytokines, and chemokine. qPCR measured reduced mRNA expression of IL1b, Tgfb1, Tnfa, Myd88, Nfkb, and Ccl2 in the livers of ABX-treated mice compared to untreated mice. ABX suppressed activation of HSCs. Representative (i) and cumulative results (j) of flow cytometric assays indicated that ABX treatment reduced the frequency of activated HSCs expressing Col1a and α-SMA in CL-HFS-fed mice. n = 5, data are presented as mean ± SD. Statistical analysis of data was performed by one-way analysis of variance (ANOVA) with Tukey’s multiple comparison test using GraphPad Prism 8 software. Source data are provided as a Source Data file.

