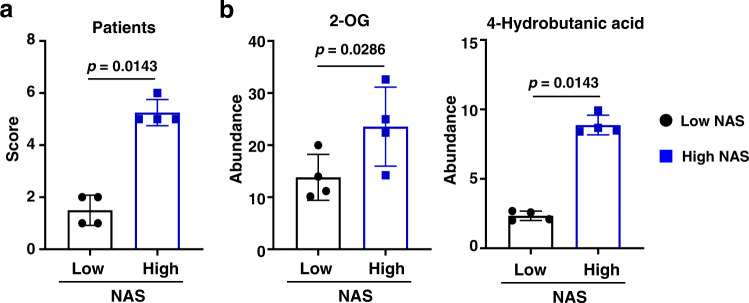
Fig. 4. Discrepancies of liver metabolites in patients with obesity and with or without NASH.
a NAS in patients with obesity and with or without NASH. According to NAS, eight patients with obesity were divided into two groups: patients with obesity and NAS > 4 (high) and individuals with obesity and NAS < 4 (low). b Significantly increased production of hepatic 2-OG and 4-Hydroxybutanoic acid in patients with obesity and high NAS compared to that in patients with obesity and low NAS. n = 4, data are presented as mean ± SD. Statistical analysis of data was performed by Mann–Whitney test (one-tailed) using GraphPad Prism 8 software. Source data are provided as a Source Data file.

