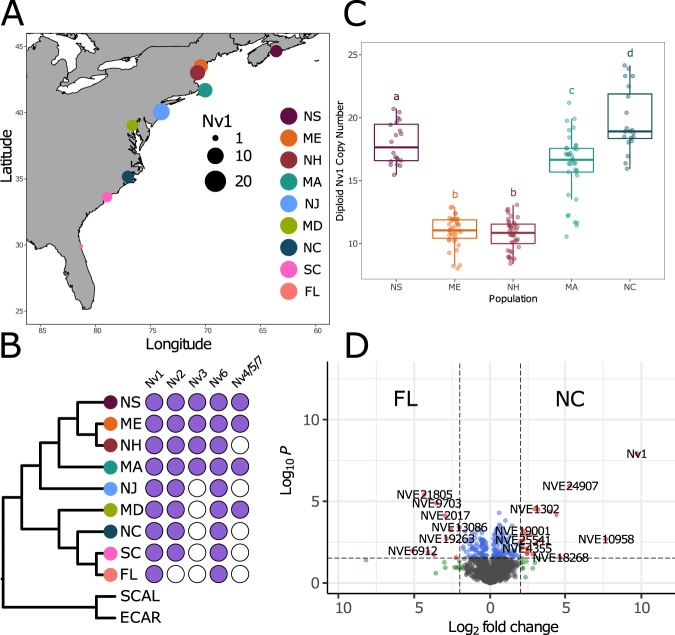
Fig. 4. Diversity of NaTx paralogs among N. vectensis populations.
A Map showing the location of the sampled populations across North America. Allele diversity represented by size of dot plot at different locations. Florida (FL), Massachusetts (MA), Maryland (MD), Maine (ME), North Carolina (NC), New Hampshire (NH), New Jersey (NJ), Nova Scotia (NS), and South Carolina (SC). B Population structure of N. vectensis generated using a maximum-likelihood tree from protein sequences and presence/absence of previously characterized NaTx paralogs in N. vectensis. C Boxplots of diploid copy number estimated using qPCR from samples collected from the five populations. The median is represented by the bold horizontal line and the upper and lower hinges represent the 75th and 25th percentiles, respectively. The boxplot whiskers extend to the largest and smallest values within 1.5 * IQR (interquartile range) for the upper and lower whiskers, respectively. All individual copy number estimates are shown for each boxplot. ANOVA revealed a significant effect of population on diploid copy number (one-tailed test, P < 2e-16; Supplementary Data 13). The letters above boxplots indicate the results of a Tukey–Kramer post hoc test controlling for the family-wise error rate (a = 0.05), with all population comparisons showing significant copy number differences (P < 0.05; see Supplementary Data 14 for pairwise comparisons) unless they share the same letter. D Volcano plot representing proteins of significantly different abundance, measured as label-free quantification (LFQ) intensity, between FL and NC. Gray dots represent proteins that are not significant, blue dots are proteins with significant P value < 0.01, green dots are proteins with Log2 fold change of >2, red dots are proteins with significant P value and Log2 fold change.

