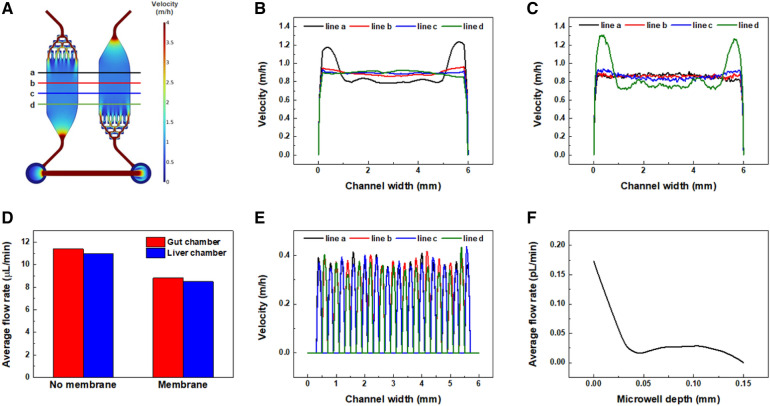
Fig. 2.
Computational fluid dynamics simulation model for the analysis of flow distribution during osmotic pumping in a gut-liver axis chip system. A Flow distribution in a gut-liver axis chip. B The velocity profile in the gut chamber. Each dataset was extracted from the respective cutline a, b, c, and d as marked in A. C The velocity profile in the liver chamber. D Comparison graph showing the difference in average flow rate between membrane and no membrane. The insertion of membranes reduced the average flow rate by about 23%. E Velocity profile on the top of microwell arrays. F Average flow rate profile inside microwell arrays from the top to the bottom of the microwells

