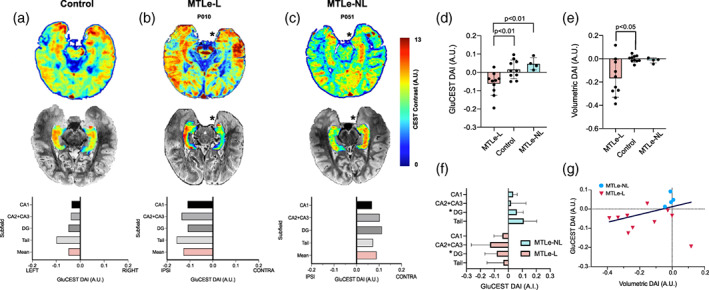
FIGURE 1.

(a–c) GluCEST signal varies based on sclerosis. Top: Representative 2D GluCEST slice for a control (a), MTLe‐L (b) and MTLe‐NL (c) subject. * represents the ipsilateral side based on the lateralization of the epileptic seizure onset zone as determined by pre‐surgical evaluation. Subject P051 mirrored for ease of comparison. Middle: The same slice but with only the hippocampal segmentation GluCEST map, overlaid on the T2 structural image. Bottom: GluCEST DAI for each subfield, as well as the mean GluCEST DAI across subfields. (d) Whole hippocampus GluCEST DAI for the three groups. (e) Whole hippocampus volumetric DAI for the three groups. (f). Subfield DAI for the MTLe‐L and MTLe‐NL groups. * represents that the subfield DAI between the groups is significantly different (p < .05). (g) Scatterplot with iteratively reweighted least squares (IRLS) linear fit of volumetric DAI versus GluCEST DAI. A.U., arbitrary units; DAI, directional asymmetry index
