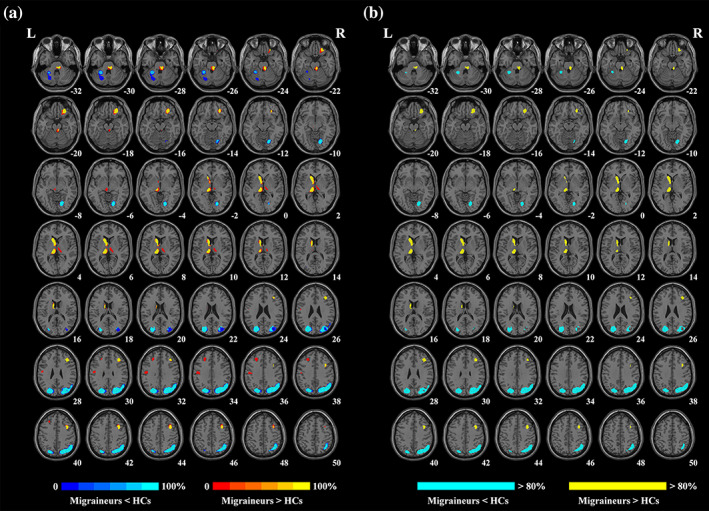
FIGURE 3.

Results of the jackknife sensitivity analysis. (a) The voxel‐wise probability map presents significant clusters in jackknife analysis, and the value in each voxel represents the probability of occurrence in all iterations. (b) Regions that survived more than 80% iterations. HCs, healthy controls; L, left; R, right
