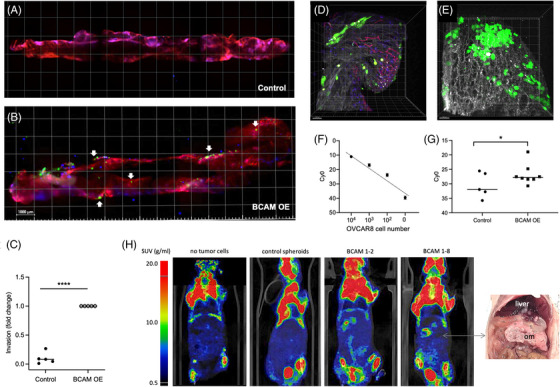
FIGURE 8.

Effect of BCAM on invasion of mouse omentum by tumour cell spheroids. (A, B) Representative light‐sheet microscopic images showing the invasion of explanted mouse omentum ex vivo by spheroids derived from control (A) and BCAM1‐overexpressing (B) OVCAR8 cells pre‐labelled with Cell Tracker Green. Spheroids derived from equal numbers of cells were added to freshly resected omentum and co‐cultured for 48 h. Thereafter, the omentum was stained for immune cells (CD45; blue) and microvessels (CD31; red) and observed by light‐sheet microscopy. Arrows point to areas of tumour cells that are not in the vicinity of milky spots (examples). These areas are characterised by the absence of CD45+ cell clusters (blue), which appear purple if co‐localising with CD31+ endothelial cells. Scale bar: 1000 μm. The sharp blue spots represent staining artefacts. (C) Quantification of the number of invaded cells analysed as in panels A and B for n = 5 biological replicates. ****p < .0001 by t test. (D, E) Multiphoton microscopy of tumour cells from BCAM‐overexpressing OVCAR8 spheroids pre‐labelled with Cell Tracker Green. Collagen fibres are visualised in white by second‐harmonic generation. Panel D shows the area below a milky spot, panel E an area distant from milky spots. Scale bar: 50 μM. (F) Validation of Taqman‐PCR for the quantification of tumour cell invasion into omentum. Genomic DNA from human OVCAR8 cells and mouse omentum (100 pg) were mixed at the indicated ratios and the signal for human DNA (hAlu sequences) was determined. The plot shows a linear relationship between signal intensity and the amount of human DNA. (G) Quantification by Taqman‐PCR of human DNA in omentum samples after incubation with spheroids generated from control and BCAM1‐overexpressing OVCAR8 cells as in panels A–E. The plot shows the data for n = 5–8 biological replicates as indicated by symbols. *p < .05; by t‐test. (H) Longitudinal 18F‐FDG PET/CT images of mice 28 days after i.p. injection of spheroids derived from OVCAR8 control cells and from two different clones of BCAM‐overexpressing OVCAR8 cells. Leftmost image: mouse not inoculated with tumour cells for comparison. The picture on the right shows large space‐occupying BCAM1‐8 tumour masses in the omentum (om) displacing the liver and other organs.
