
FIGURE 5.
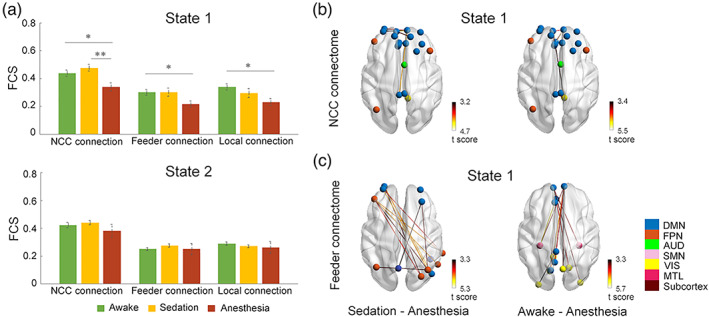
Dynamic NCC signatures track loss of consciousness during Propofol anesthesia. (a) Differences in dynamic FC of NCC, feeder, and local connections from awake to sedation and unconsciousness during each state. (b) NCC connections show significant reductions in NBS between different conscious levels during state 1. (c) Feeder connections show significant reductions in NBS between different conscious levels during state 1. The color of nodes indicates modular affiliation. *p uncorrected < .05; **p corrected <.05