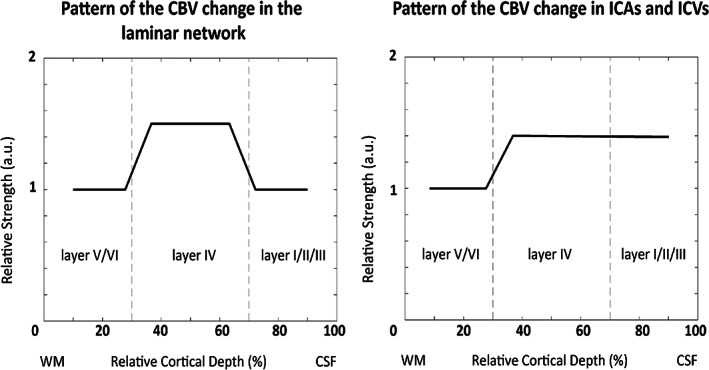
FIGURE 2.

The pattern of the CBV change in the laminar network (left), and ICAs and ICVs (right) across the layers used in our simulations. According to the result shown in Figure 3 of Zhao et al. (2006), we assumed a higher CBV change in middle cortical layers by a factor of 1.5 in the laminar network. To accommodate this higher laminar CBV change we assumed a higher corresponding CBV change in ICAs and ICVs in the middle and superficial layers that drain the middle cortical layers. This step pattern represents an additional CBV change on top of the baseline CBV”.
