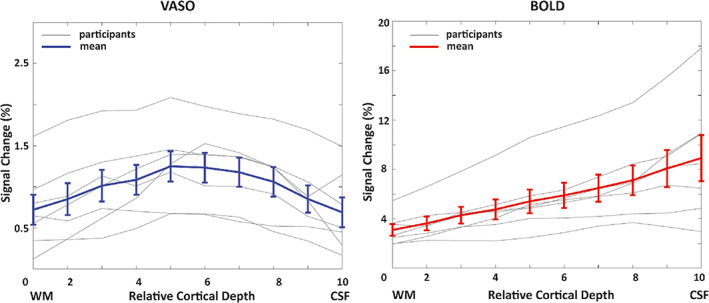
FIGURE 5.

Depth‐dependent VASO and BOLD signal changes (%) in human V1 for each individual participant (gray) and averaged across all participants (blue and red). Note that the profiles plotted here are the average of the percentage signal change extracted from each layer. The error bars in this and all following graphs refer to the standard error of the mean across all participants.
