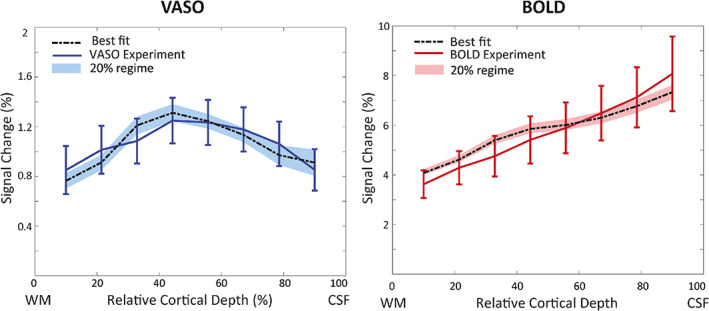
FIGURE 6.

The measured VASO (left) and BOLD (right) profiles and the simulated profiles with the lowest RMSE (black line) assuming a depth‐dependent baseline CBV in the laminar network (Figure 1). The shaded area shows the VASO and BOLD simulated profiles with RMSE 20% higher than the minimum RMSE.
