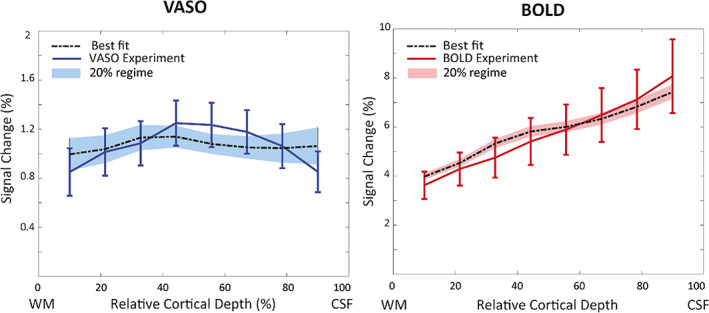
FIGURE 8.

The measured and simulated VASO and BOLD profiles assuming a depth‐dependent baseline CBV in the laminar network, but constant activation strength across depths. The simulated VASO profile deviates considerably from the measured response, whereas the fit to the BOLD data is comparable to the scenario with depth‐dependent nonuniform activation strength.
