
FIGURE 5.
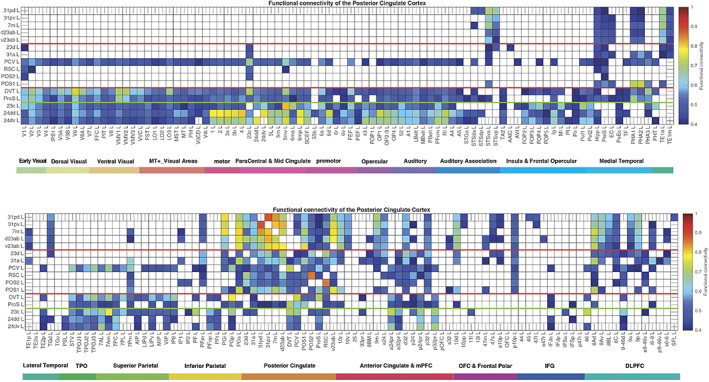
Functional connectivity between the posterior cingulate cortex division regions and 180 cortical areas in the left hemisphere. Functional connectivities <0.4 are shown as blank. The upper figure shows the functional connectivity of the 16 regions with the first half of the cortical areas (including the subiculum); the lower figure shows the functional connectivity with the second half of the cortical areas. Abbreviations: See Table S1. The three groups of posterior cingulate cortex division regions are separated by red lines; and the MCC functional connectivity is shown below the green line.