
FIGURE 6.
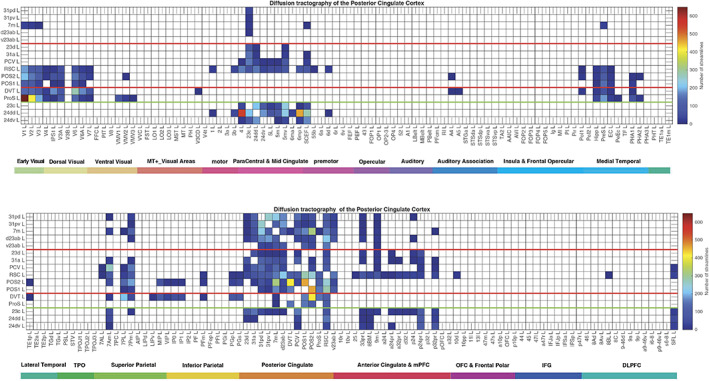
Connections between the posterior and MCC and 181 cortical areas in the left hemisphere as shown by diffusion tractography using the same layout as in Figures 2 and 4. The number of streamlines shown was thresholded at 10 and values less than this are shown as blank. Abbreviations: See Table S1. The three groups of posterior cingulate cortex areas are separated by red lines; and the MCC connections are shown below the green line.