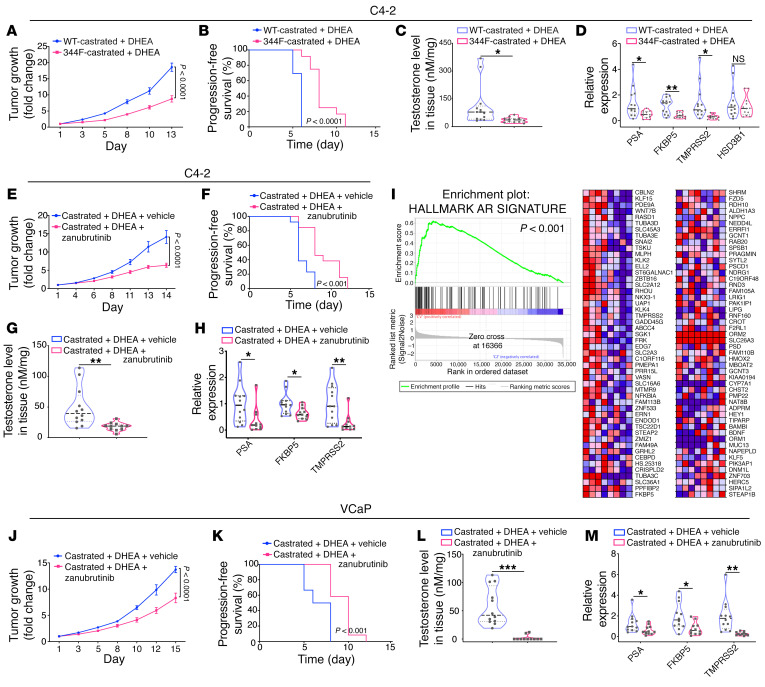
Figure 5. BMX pharmacologic blockade and 3βHSD1-Y344F inhibit androgen biosynthesis and CRPC growth in vivo.
(A) C4-2 cells with stable shRNA-mediated knockdown of 3βHSD1 were stably infected with a lentivirus expressing WT 3βHSD1 or 3βHSD1-Y344F. Mice were subcutaneously injected with 10 million cells, and castration plus DHEA pellet implantation were performed after tumors reached 200 mm3. Tumor growth is shown as fold change from the time of treatment initiation for each tumor. The numbers of mice in the WT-3βHSD1/castration and 344F-3βHSD1/castration groups were 13 and 12, respectively. (B) Progression-free survival was assessed as time to 3-fold increase in tumor volume from treatment initiation. (C) The testosterone concentration in xenograft tumors was detected by mass spectrometry. (D) RNA was extracted from xenograft tumors, and expression of AR-responsive genes (PSA, FKBP5, and TMPRSS2) and HSD3B1 was determined by qPCR. Expression was normalized to control and RPLP0 expression. (E) 6 million C4-2 cells were injected subcutaneously in mice, and castration, DHEA-pellet implantation, and treatment with vehicle or zanubrutinib at a dose of 15 mg/kg by oral gavage twice daily was performed after tumors reached 150 mm3. Tumor growth was assessed as fold change from time of treatment initiation. The numbers of mice in the castration/vehicle and castration/zanubrutinib groups were 13 and 12, respectively. (F) Progression-free survival was assessed as time to 3-fold increase in tumor volume from treatment initiation. (G) Tumor testosterone in xenograft tumors was detected by mass spectrometry. (H) Expression of AR-regulated genes was assessed by qPCR and expression was normalized to control and RPLP0 as in D. (I) RNA-Seq and GSEA was performed, showing AR inhibition as the top upstream regulator predicted to be inhibited. (J) Ten million VCaP cells were injected subcutaneously. Castration, DHEA-pellet implantation, and vehicle or zanubrutinib at a dose of 15 mg/kg by oral gavage twice daily were performed after tumors reached 200 mm3, and fold change in tumor volume from the time of treatment initiation was assessed. The numbers of mice in the castration/vehicle and castration/zanubrutinib groups were 12 and 11, respectively. (K) Progression-free survival was assessed as in B. (L) Xenograft testosterone detection by mass spectrometry. (M) AR-regulated genes were assessed as in D. For A, E, and J, P values were calculated by 2-way ANOVA with Bonferroni’s multiple comparisons test. For B, F, and K, P values were calculated with a log-rank test. For C, D, G, H, L, and M, P values were calculated using an unpaired 2-tailed t test. *P < 0.05, **P < 0.01, ***P < 0.001.

