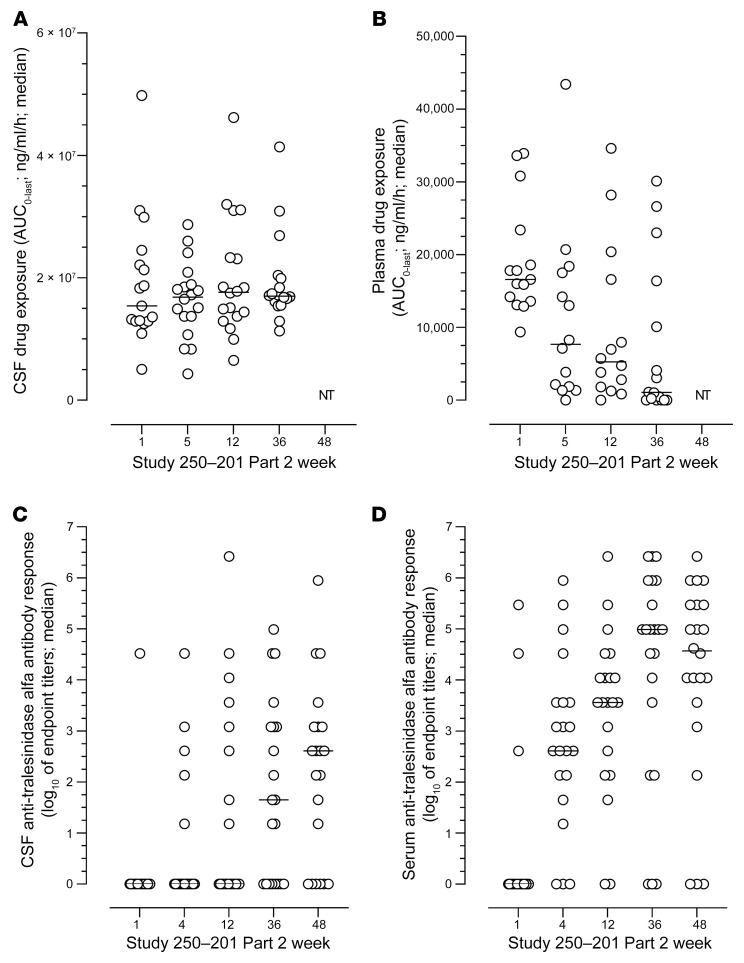
Figure 2. Drug exposure in plasma and CSF and anti-drug antibody response in serum and CSF.
(A) Patients were treated i.c.v. weekly from weeks 1 to 48 (n = 22). Total exposure in CSF was calculated as the AUC0–last in samples collected 0.5, 4, 10, 24, 48, 72, 96, and 168 hours after drug administration at week 1 (baseline) and at weeks 5, 12, and 36 of Study 250-201 Part 2. (B) similarly, total exposure in serum was calculated as the AUC0–last at weeks 1 (baseline), 5, 12, and 36 of Study 250-201 Part 2. Anti-drug antibodies were measured in CSF (C) and serum (D) at week 1 (baseline) and at weeks 4, 12, 36, and 48 of Study 250-201. Quantification of tralesinidase alfa and titration of anti-drug antibody response were done as described in Methods. NT, not tested (i.e., samples were not collected for PK analysis at week 48). Data are presented as scattered plots with median values.

