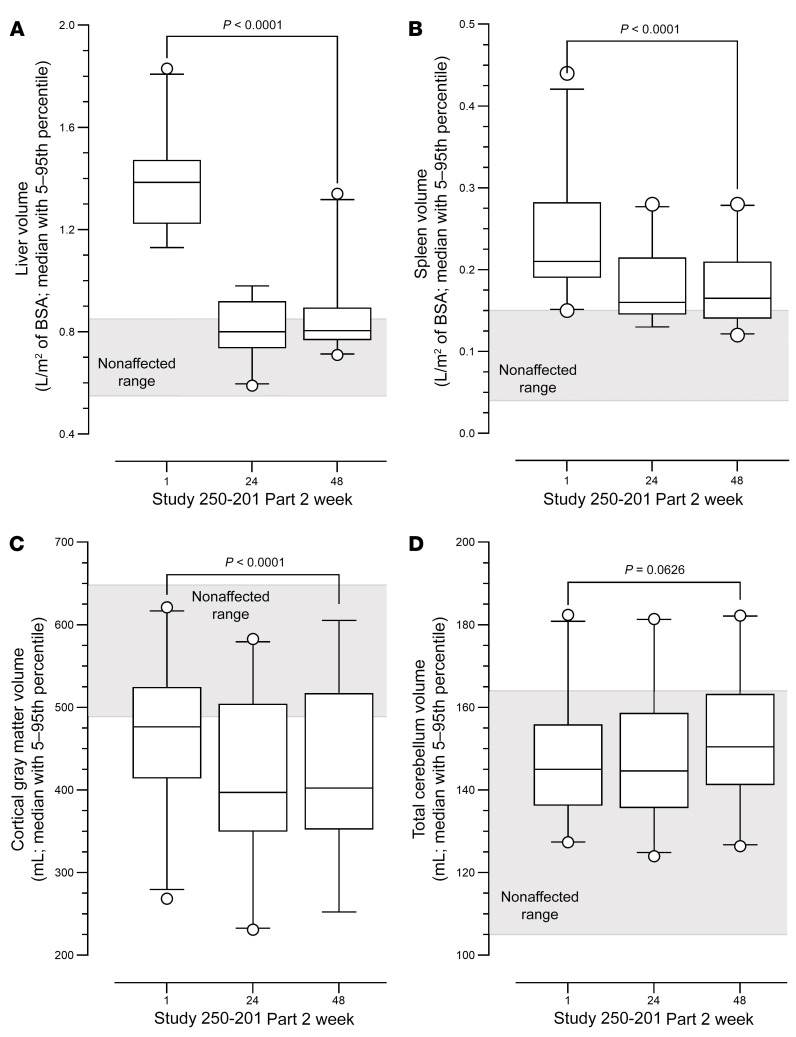
Figure 4. Changes in liver, spleen, cortical gray matter, and cerebellum gray matter volumes over the course of Study 250-201 Part 2.
Liver (A), spleen (B), and brain subregions (C and D) were measured by MRI at week 1 (baseline) and weeks 24 and 48. Ranges for nonaffected patients were defined on the basis of previous publications (13, 14, 36, 37). MRI data were collected as described in Methods. Liver and spleen volumes in A and B were adjusted for BSA. Individual values in C and D for each participant at week 1 of Part 1 and weeks 1, 24, and 48 of Part 2 are listed in Supplemental Table 5. Boxes represent the 5th–95th percentiles with the median; dots represent values outside the 5th–95th percentiles. P values comparing week 1 (baseline) with week 48 were calculated using a 2-tailed, paired t test as determined by GraphPad Prism 9.3.1. n = 22 for liver and spleen; n = 19 and n = 20 for cortical gray matter and cerebellum, respectively.

