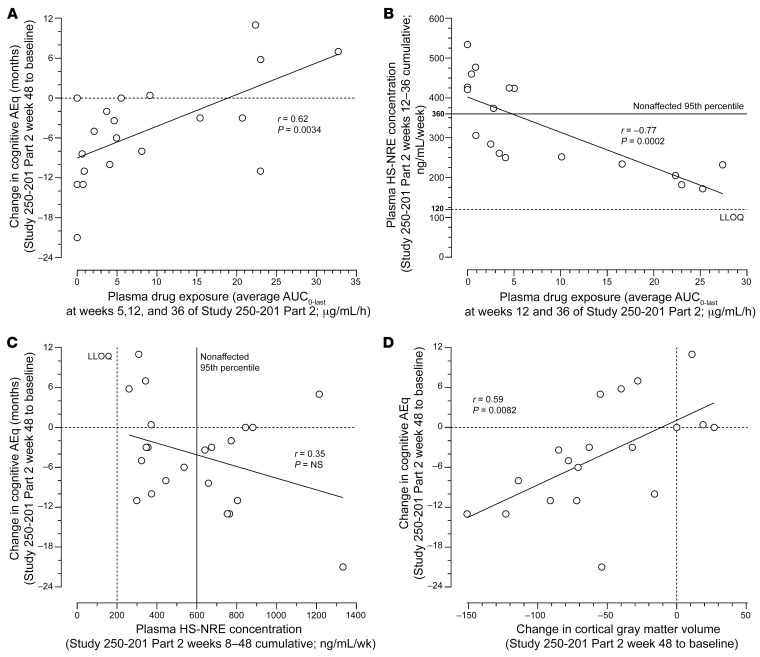
Figure 5. Correlation analyses of cognitive AEq scores, plasma drug exposure, plasma HS-NRE concentrations, and CGMVs over 48 weeks of tralesinidase alfa treatment.
(A) Change in cognitive AEq score from Study 250-201 Part 2, week 1 to week 48, versus the average plasma drug exposure, i.e., AUC0–last, at weeks 5, 12, and 36 of Study 250-201 Part 2. (B) Plasma HS-NRE cumulative concentrations from weeks 8 to 48 of Study 250-201 Part 2 versus the average plasma drug exposure, i.e., AUC0–last, at weeks 5, 12, and 36 of Study 250-201 Part 2. the HS-NRE LLOQ was defined as 200 ng/mL/week, i.e., 5 ng/mL/week times 40 weeks, whereas the 95th percentile for nonaffected individuals was defined as 15 ng/mL/week times 40 weeks. (C) Change in cognitive AEq scores from Study 250-201 Part 2, weeks 1 to 48, versus plasma HS-NRE cumulative concentrations from weeks 8 to 48 of Study 250-201 Part 2. (D) Change in cognitive AEq scores from Study 250-201 Part 2, weeks 1 to 48, versus the change in CGMVs from Study 250-201 Part 2, weeks 1 to 48. Pearson’s r correlation and P values were calculated using GraphPad Prism 9.3.1. n = 20, n = 18, n = 22, and n = 19 for A–D, respectively.

