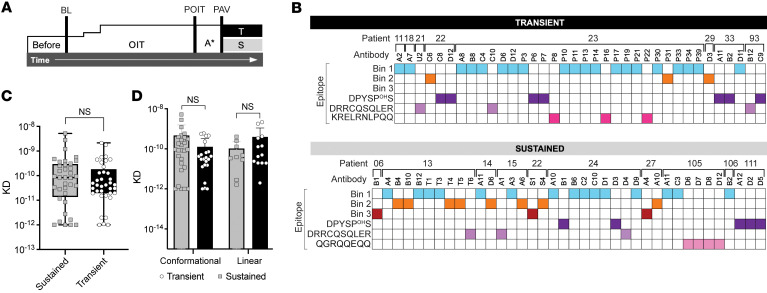
Figure 2. Characterization of high-affinity Ara h 2 epitope–specific antibodies from OIT-treated individuals.
(A) Clinical schema of peanut OIT, where tolerance to peanut after 1 year of OIT (POIT) followed by tolerance PAV (A* 1–3 months) led to classification as sustained (S) or transient (T) responders. (B) Epitope specificity of mAbs from peanut OIT. (C and D) Affinity of Ara h 2 antibodies for native Ara h 2 measured by BLI (sustained responders are shown in gray and transient responders in black). Box-and-whisker plots represent the mean, quartiles, and range. Statistical comparison was performed with a Mann-Whitney U test.

