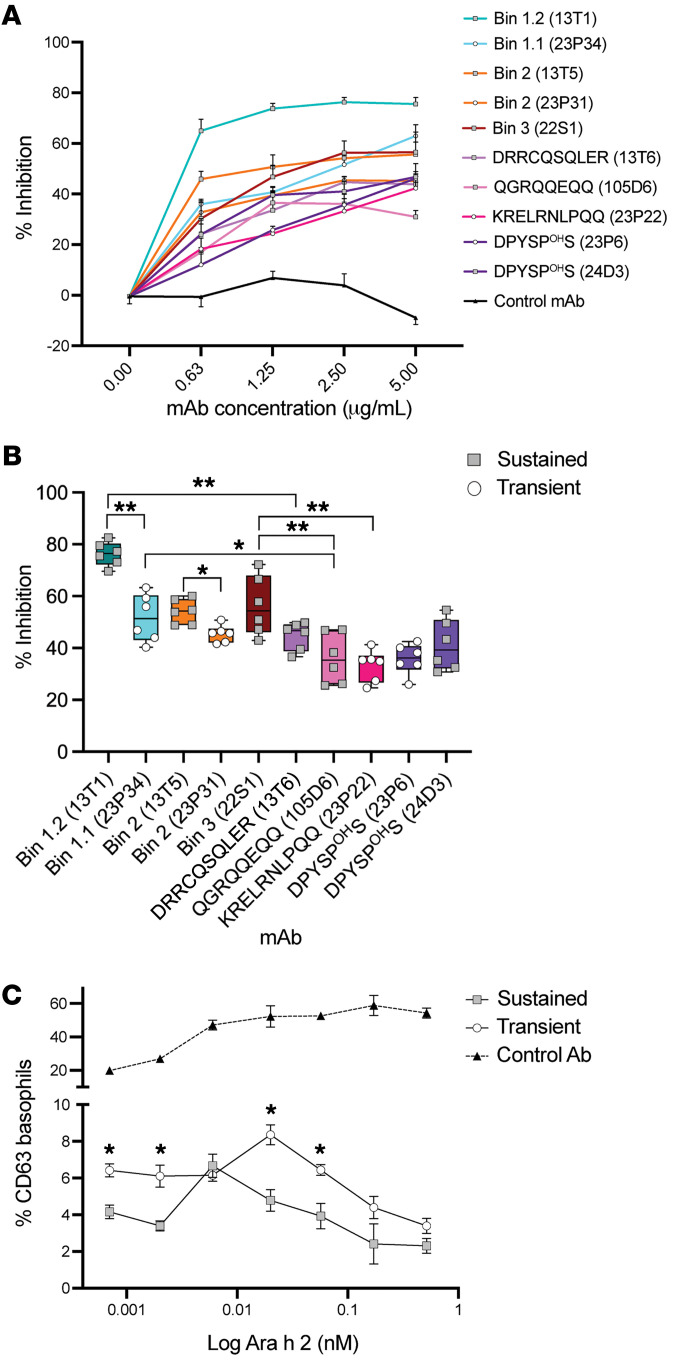
Figure 5. Allergen neutralization by Ara h 2 antibodies.
(A) Antibody saturation curves with a competitive inhibition ELISA using Ara h 2 mAbs to evaluate inhibition of pooled serum IgE from 6 patients. Serially diluted Ara h 2 mAbs were added to the ELISA wells. Data are expressed as the mean ± SEM of 6 replicate wells. (B) Percentage of inhibition of pooled serum IgE by individual Ara h 2 mAbs normalized to serum IgE without antibody controls (shading by epitope). mAbs from transient responders (white circles) and sustained responders (gray squares) are represented. Data are expressed as the mean ± SEM of 6 replicate wells. Multiple comparisons were performed by ANOVA and corrected using the FDR; adjusted *P < 0.05 and adjusted **P < 0.001. (C) iBAT dose-response curve for Ara h 2 preincubated with a nonspecific control antibody (black triangles), sustained antibody mix (gray squares), or a transient antibody mix (white circles) measured by the percentage of CD63 upregulation on human basophils. Data are expressed as the mean ± SEM of 3 replicates. *P < 0.05, by Student’s t test.

