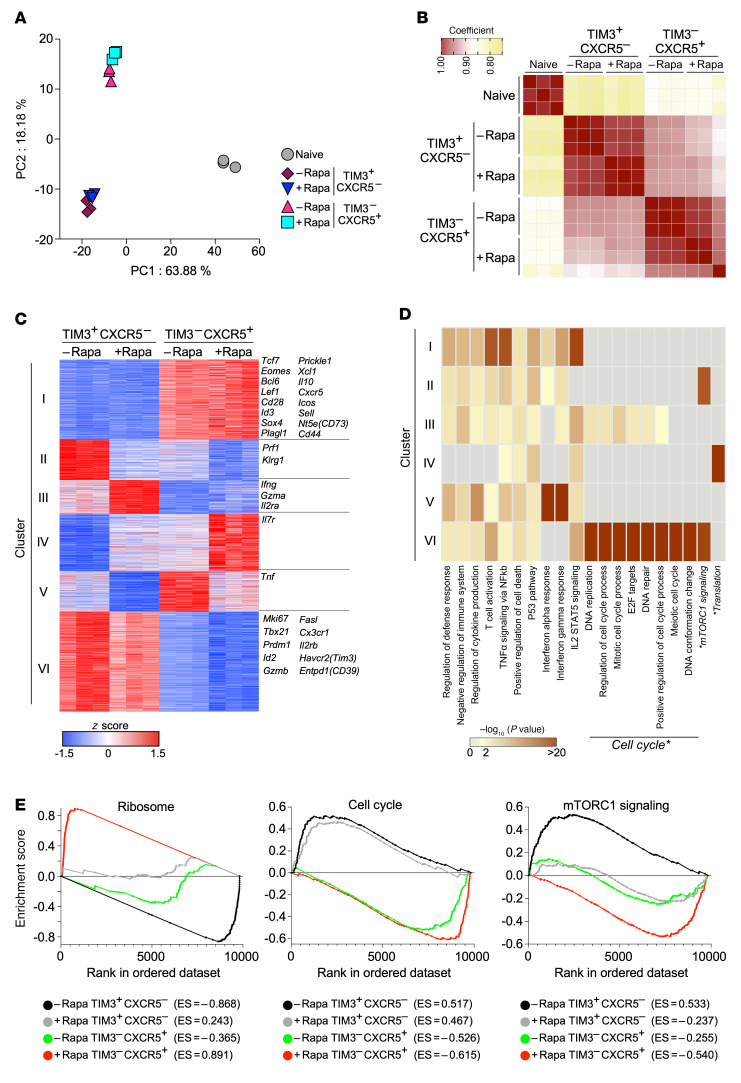
Figure 2. Transcriptional signatures of stem-like and TIM3+ differentiated CD8+ T cells generated in rapamycin-treated mice.
LCMV clone 13–infected mice were treated or not with rapamycin from day –1 to day 9. At day 10 after infection, stem-like (TIM3–CXCR5+PD-1+) or TIM3+ more-differentiated (TIM3+CXCR5–PD-1+) CD8+ T cells were sorted, and RNA-Seq was performed. Naive CD8+ T cells (CD44loCD8+) from uninfected mice were sorted for RNA-Seq as a control. See Supplemental Figure 4 for gating strategy. (A) Principal component analysis. (B) Heatmap illustrating Spearman’s correlation among individual samples. (C) Heatmap showing the relative expression (z score) of the top 3,000 genes that were differentially expressed among 4 populations (TIM3+ more-differentiated (TIM3+CXCR5–) CD8+ T cells [rapamycin vs. control] and stem-like (TIM3–CXCR5+) CD8+ T cells [rapamycin vs. control]). Genes were divided into 6 clusters by K-means clustering based on expression. (D) Metascape analysis showing the biological processes associated with genes in the 6 clusters of genes shown in C. The biological processes marked by asterisks were described in the main text and further analyzed in E. (E) Gene set enrichment analysis (GSEA) of TIM3+ differentiated (TIM3+CXCR5–) and stem-like (TIM3–CXCR5+) CD8+ T cells from rapamycin-treated and untreated mice using gene sets for ribosome, cell cycle, and mTORC1 signaling. GSEA was performed by comparing gene expression data from each cell population with the combined data from the remaining 3 other populations. Data are from 3 independent experiments with samples pooled from 4 to 6 mice for sorting individual cell populations.

