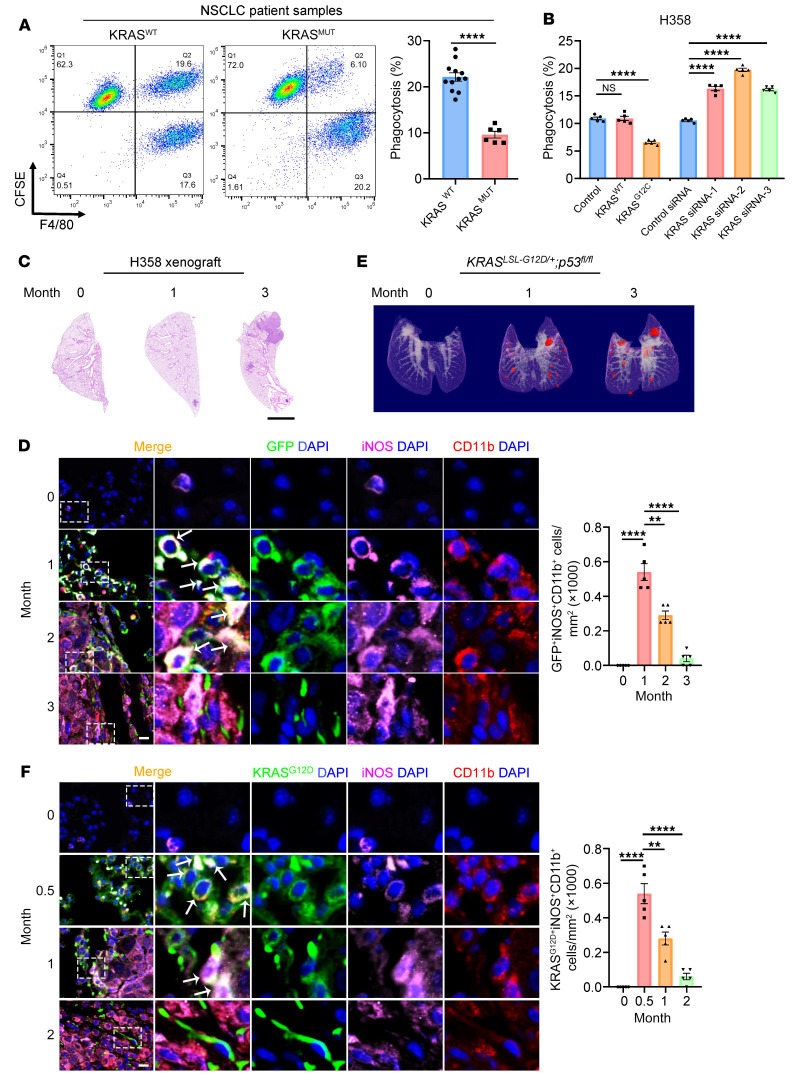
Figure 1. Oncogenic KRAS mutations render lung cancer cells insensitive to macrophage phagocytosis.
(A) Tumor cells were isolated from 12 KRASWT and 6 KRASMUT lung adenocarcinoma patients, labeled with the fluorescent dye CFSE, incubated with human peripheral blood monocyte–derived macrophages for 2 hours, stained with F4/80, and analyzed by flow cytometry. Phagocytosis rate was calculated as the percentage of CFSE+F4/80+ cells among CFSE+ cells. Representative FACS results and quantification for all patients are shown. (B) KRASG12C H358 cells were transfected with plasmids expressing KRASWT or KRASG12C or with 3 KRAS siRNAs. After 48 hours, the cells were subjected to a phagocytosis assay similar to that in A. Quantitative analysis (n = 5) is shown. NSCLC, non–small cell lung cancer. (C and D) Macrophage phagocytosis of H358 cells gradually decreased with tumor progression in vivo. An animal model of lung cancer was established by tail-vein injection of EGFP-labeled H358 cells into nude mice. (C) Representative images of H&E-stained lung sections at different time points are shown. Scale bar: 2 mm. (D) Macrophage infiltration into lung tumor tissue was assessed by CD11b (red) and iNOS (purple) staining. Representative images and quantification results (n = 5) are shown. Arrows indicate GFP+iNOS+CD11b+ cells. Scale bar: 50 μm. Original magnification, ×40 (enlarged insets). (E and F) Macrophage phagocytosis of tumor cells gradually decreased with tumor progression in genetic models of lung cancer. KrasLSL-G12D/+ p53fl/fl mice were intratracheally administered adeno-Cre to trigger pulmonary adenocarcinoma formation. Tumor growth was monitored by micro-CT at different time points. (E) Representative 3D reconstructions of mouse lungs. Tumors are shown in red. (F) Macrophage infiltration was assessed by staining for CD11b (red), iNOS (purple), and KRASG12D (green). Representative images and quantification results (n = 5) are shown. Arrows indicate KRASG12D+iNOS+CD11b+ cells. Scale bar: 50 μm. Original magnification, ×40 (enlarged insets). Data are shown as the mean ± SEM. **P < 0.01 and ****P < 0.0001, by unpaired t test (A) or 1-way ANOVA (B, D, and F).

