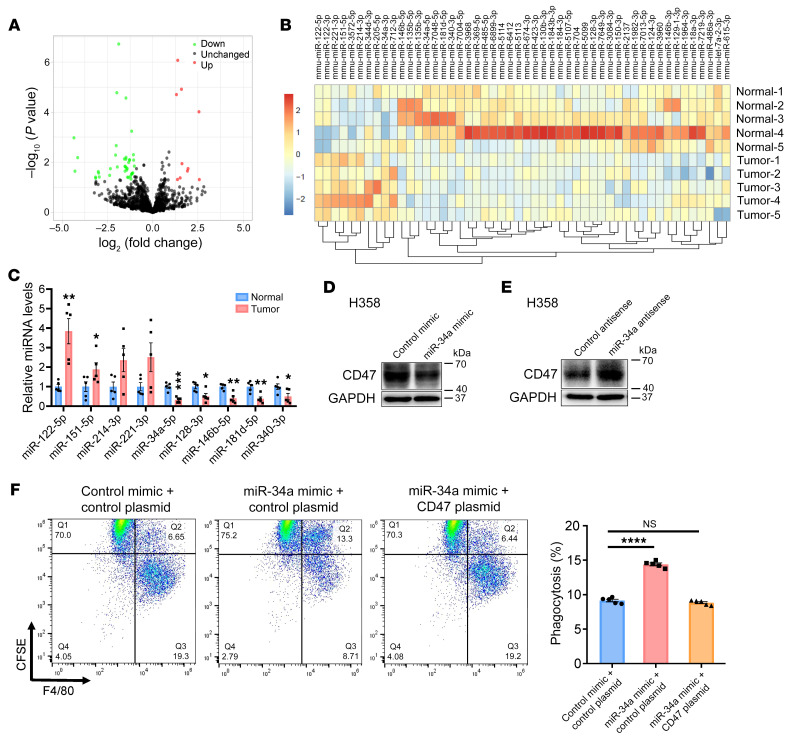
Figure 3. miR-34a restricts CD47 activity and restores the phagocytic function of macrophages in vitro.
(A) Scatter plot comparison illustrating miRNAs that were differentially expressed between malignant and normal lung tissues from KrasLSL-G12D/+ mice. Down, downregulated; Up, upregulated. (B) Dendrogram generated by unsupervised hierarchical cluster analysis showing the separation of tumors from normal tissues based on miRNA profiling (10 upregulated vs. 40 downregulated). (C) Quantitative RT-PCR analysis of the 9 most changed miRNAs in A (n = 5 mice). (D and E) Effect of the miR-34a mimic or the miR-34a antisense strand on CD47 expression in H358 cells. (F) Effect of the miR-34a mimic on macrophage phagocytosis of H358 cells. Cells were transfected with the miR-34a mimic and/or a CD47-expressing plasmid. After 48 hours, cells were subjected to a macrophage phagocytosis assay. Representative FACS images and quantification results (n = 5) are shown. Data are shown as the mean ± SEM. *P < 0.05, **P < 0.01, ***P < 0.001, and ****P < 0.0001, by unpaired t test (C) or 1-way ANOVA (F).

