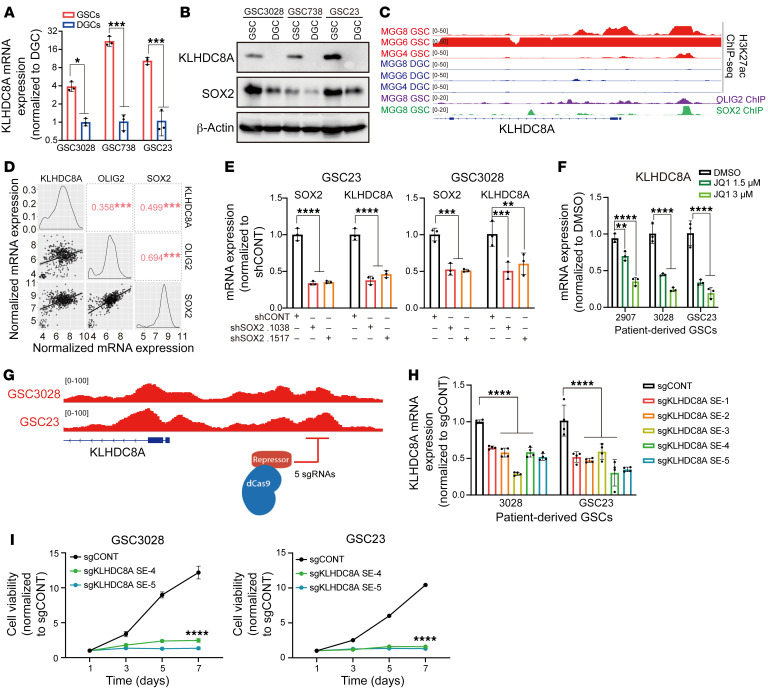
Figure 3. KLHDC8A expression is driven by SOX2 and a GSC superenhancer in GSCs.
(A) KLHDC8A mRNA expression was measured in 3 matched pairs of GSCs and DGCs by qPCR analysis. n = 3. Quantitative data from 3 independent experiments are shown as mean ± SD. Statistical analysis was performed using Student’s t-test with the Holm-Šidák multiple test correction. (B) Protein levels of KLHDC8A were measured by immunoblot following KLHDC8A knockdown. SOX2 was used as the stemness marker. β-Actin was used as the loading control. (C) H3K27ac signals at the KLHDC8A superenhancer region in 3 pairs of GSCs and DGCs (MGG4, MGG6, and MGG8). SOX2 and OLIG2 ChIP-Seq signals are shown at the superenhancer region of MGG8. (D) Correlation of mRNA expression between KLHDC8A, OLIG2, and SOX2 in the TCGA HG-U133A glioblastoma data set. Numbers indicated the R value of Spearman correlation. (E) qPCR analysis of mRNA expression of SOX2 and KLHDC8A upon knockdown of SOX2. n = 3. Quantitative data from 3 independent experiments are shown as mean ± SD. Statistical analysis was performed using 2-way ANOVA with Dunnett’s multiple test correction. (F) qPCR analysis of mRNA expression of KLHDC8A following treatment with 2 concentrations of JQ1 (1.5 and 3 μM) for 24 hours. n = 3. Quantitative data from 3 independent experiments are shown as mean ± SD. Statistical analysis was performed using 2-way ANOVA with Dunnett’s multiple test correction. (G) Schematic displaying targeting of the KLHDC8A superenhancer region using dCas9-KRAB system with 5 nonoverlapping sgRNA targeting critical KLHDC8A superenhancer locus. (H) The mRNA expression of KLHDC8A in GSC23 and GSC3028 was measured by quantitative PCR. n = 4. Quantitative data from 4 independent experiments are shown as mean ± SD. Statistical analysis was performed using 2-way ANOVA with Dunnett’s multiple comparison. (I) Proliferation of GSCs measured by CellTiter-Glo assay in GSC23 and GSC3028 overexpressing dCas9-KRAB and 5 sgRNAs over a 6-day time course. n = 4. Quantitative data from 4 technical replicates are shown as mean ± SD. Statistical analysis was performed using 2-way ANOVA with Dunnett’s multiple test correction. *P < 0.05, **P <0.01, ***P < 0.001, ****P < 0.0001.

