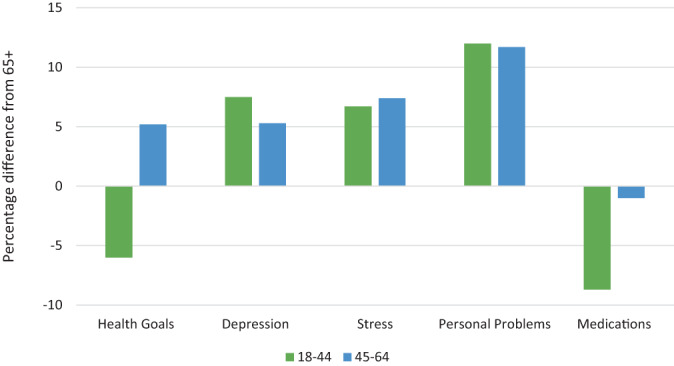
FIGURE 1.

Unadjusted differences in discussion of outcomes compared to the 65+ age group. Positive values indicate that an age group had a higher predicted probability of achieving the outcome compared to the 65+ group. Negative values indicate that an age group had a lower predicted probability of achieving the outcome compared to the 65+ group. [Color figure can be viewed at wileyonlinelibrary.com]
