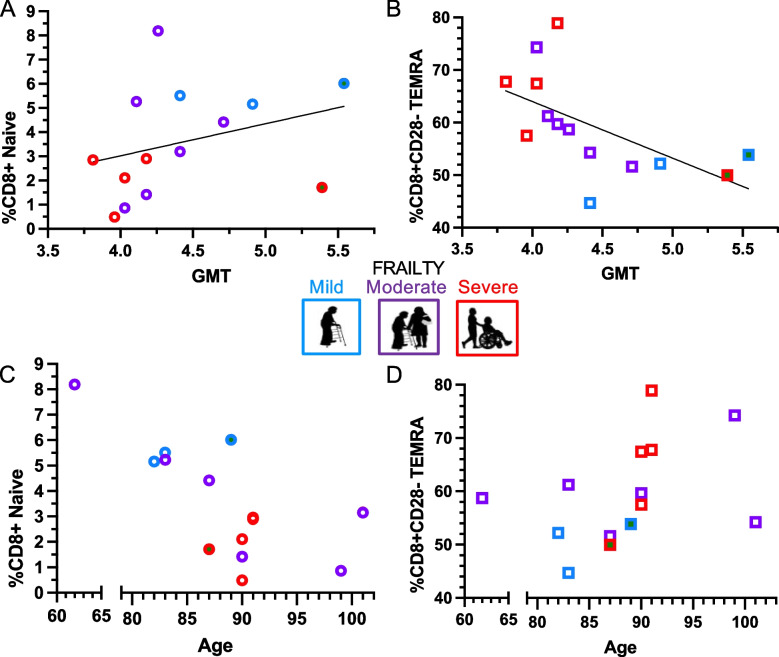
Fig. 5.
T Cell Memory Phenotype Association with Antibody Response and Frailty. T cell memory populations were associated with total antibody response (GMT) and clinical factors of frailty status and age. T cells were collected 2-weeks post vaccine dose 2, and CD8+ naive cells (CD45RA+ CCR7+) and CD8 + CD28- TEMRA cells (CD45RA+ CCR7- CD28-) evaluated based on associations with aging and impaired vaccine response in the literature. (A&B) The total antibody response to 2 vaccine doses, was calculated with the geometric mean of antibody titers (GMT) to 2 vaccine doses (from baseline to 6-months post vaccine dose 2). (A) CD8+ naive cells had a positive trend with total antibody response (p = 0.092, r2 = 0.77; adjusted for prior COVID-19, as indicated by a central green dot) (B) There was a negative association of CD8 + CD28- TEMRA cells with total antibody response (p = 0.028, r2 = 0.81; adjusted for COVID-19). (C&D) Adjusting for prior COVID-19 (indicated by a central green dot), (C) CD8+ naïve cells were decreased with higher frailty (p = 0.026) and older age (p = 0.004), and (B) CD8+ CD28- TEMRA cells were increased with severe frailty (p = 0.056), but not older age (p = 0.31)

