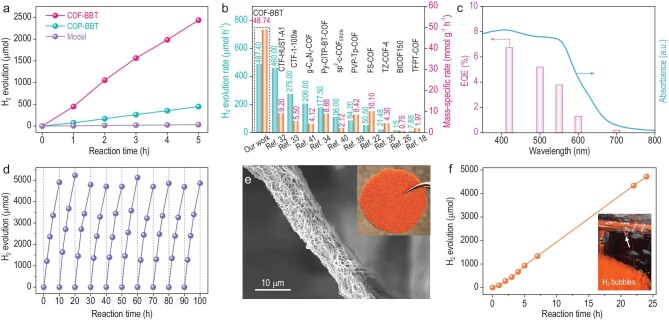
Figure 4.
Photocatalytic H2 production on COF-BBT. (a) Photocatalytic H2 production curves of COF-BBT, COP-BBT and the model molecule; (b) comparison on the photocatalytic H2 evolution rate and the mass-specific H2 evolution rate of COF-BBT and previous states of the art from literature; (c) wavelength-dependent EQE values of COF-BBT together with its UV–Vis spectra; (d) consecutive cycles of photocatalytic H2 production on COF-BBT for ≤100 h; (e) digital image and SEM image of COF-BBT loaded melamine foam; (f) photocatalytic H2 production curve of COF-BBT loaded melamine foam; the inset shows H2 bubbles evolving from the foam upon the light irradiation.

