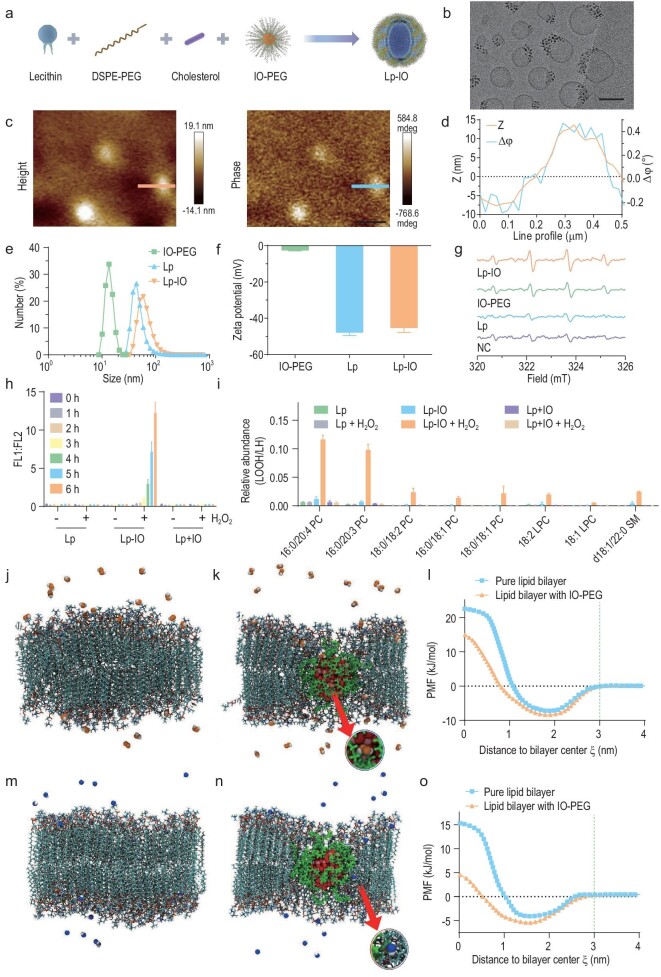
Figure 1.
Preparation, characterization, lipid peroxidation and MD simulations of Lp-IO. (a) Schematic preparation process. (b) Cyro-TEM image of Lp-IO; scale bar: 50 nm. (c) AFM (left) and MFM (right) images of Lp-IO; scale bars: 400 nm. (d) Profile analysis of line in Fig. 1c. (e) Hydrodynamic size distribution and (f) zeta potential of IO-PEG, Lp and Lp-IO. (g) X-band EPR spectra of DMPO captured hydroxyl radicals produced by H2O2 in the presence of ultrapure water (NC), Lp, IO-PEG and Lp-IO. (h and i) Lp, Lp-IO and Lp + IO were separately treated in the presence or absence of 1 mM H2O2. (h) The relative ratio of FL1 (green FL) to FL2 (red FL) from C11-BODIPY. (i) The peak area ratio of lipid hydroperoxide (LOOH) of PC, LPC and SM to12 : 0 LPC (internal standard) after treatment for 6 h. LOQ, the limit of quantification. (j and k) Typical equilibrated snapshots of H2O2 interacting with the pure lipid bilayer and the IO-PEG-doped lipid bilayer. The phospholipids (hydrogen, white; oxygen, red; nitrogen, dark blue; carbon, cyan; phosphorus, tan) and PEG chains (green) are displayed in licorice mode; the IONP (oxygen, red; iron, pink) and H2O2 molecules (hydrogen, white; oxygen, orange) are represented as van der Walls (vdW) spheres. Water molecules are not shown for clarity. (l) PMF profiles for a single H2O2 to penetrate the lipid bilayers. (m and n) Typical equilibrated snapshots of the interaction between •OH and lipid bilayers; the •OH is represented as vdW spheres (hydrogen, white; oxygen, blue). (o) PMF profiles for a single •OH to penetrate lipid bilayers.

