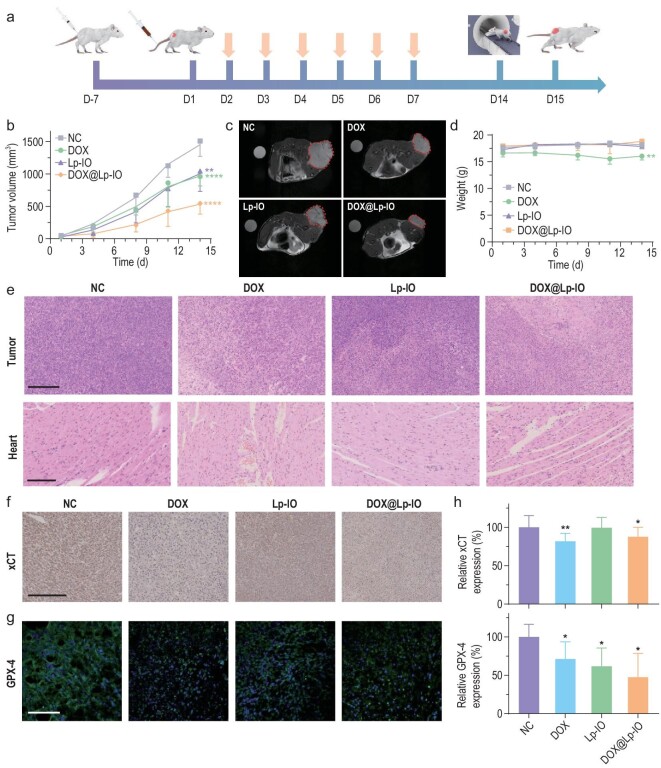
Figure 5.
In vivo antineoplastic effect of DOX@Lp-IO. (a) Schematic diagram of 4T1 tumor model fabrication and treatments with saline (NC), DOX (2.5 mg/kg), Lp-IO (Fe, 1 mg/kg) and DOX@Lp-IO (DOX, 2.5 mg/kg; Fe, 1 mg/kg) (n = 5). The arrows indicate treatment. (b) Tumor volume variation (n = 5). (c) T2-weighted MR images of tumor-bearing mice on the 18th day. Tumor tissues are labeled with borders. (d) Bodyweight variation of the mice (n = 5). (e) H&E staining of tumor and heart after treatment (n = 5); scale bars: 250 μm. The IHC staining of (f) xCT and (g) GPX-4 in tumor tissues and (h) the corresponding quantification (n = 5); scale bars: 100 μm. *: compared with NC. *, P < 0.05; **, P < 0.01; ***, P < 0.001; ****, P < 0.0001.

