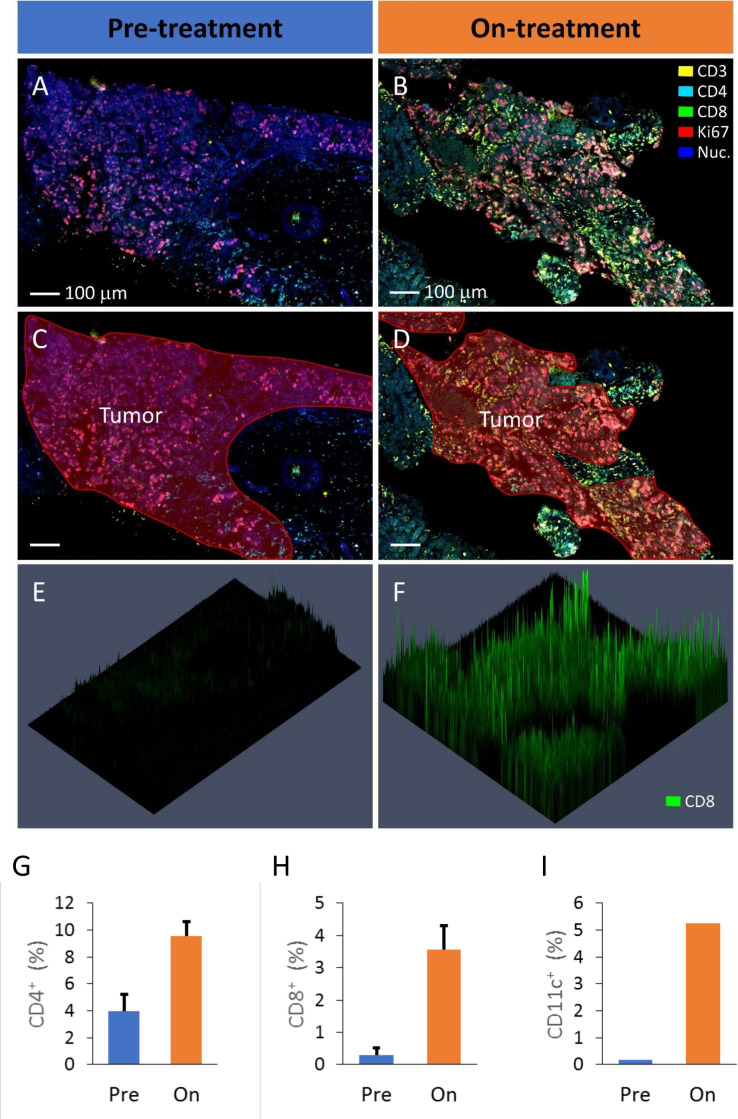
Figure 4.
Analysis of pretreatment and on-treatment liver lesion biopsies of a PR mCRC participant (Pt 059) by fluorescence multiplex microscopy. The on-treatment lesion was biopsied 5 weeks after treatment commenced. Representative areas of pretreatment (A) and on-treatment (B) lesions are shown with the regions of tumor tissue indicated in red (C, D). In this example the markers CD3 (yellow), CD4 (cyan), CD8 (green), Ki67 (red) and nuclei are stained with DAPI (blue). To exemplify CD8 staining of these biopsy regions, three-dimensional presentation of the CD8 label fluorescence intensity is presented (E, F). Identification of positively staining cells in the tumor regions of the biopsies was performed for various markers, including CD4+ cells (G), CD8+ cells (H) and CD11c+ cells (I) which were all elevated in the on-treatment biopsy compared with the prebiopsy. The CD4 and CD8 data were collected from two separately stained sections (of each biopsy) allowing the data to be averaged and errors bars included (±SE). mCRC, metastatic colorectal cancer; PR, partial response.

