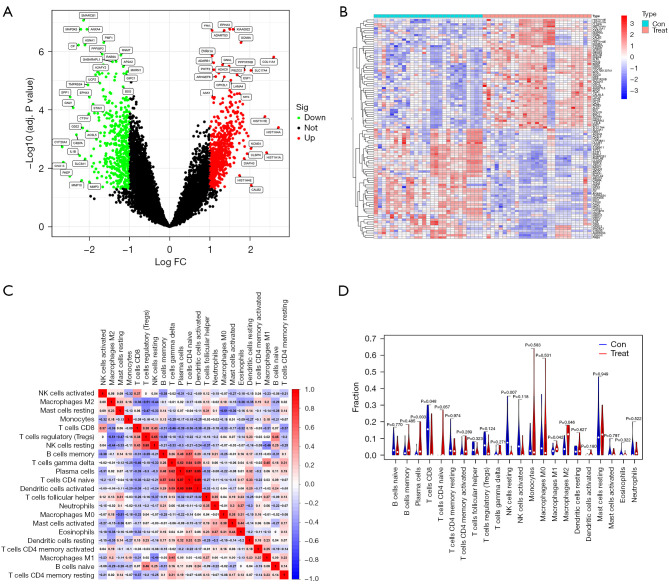
Figure 2.
Differentially expressed genes in endometriosis. (A) Volcano map of differentially expressed genes in endometriosis compared with the controls from the GSE11691and GSE120013 datasets; (B) heat map of the top 50 differentially expressed genes. Immune infiltration between endometriosis samples and control samples. (C) The relative percentage of 22 immune cells in each sample. (D) Differences in immune infiltration between endometriosis samples and control samples. FC, fold change; Con, control.

