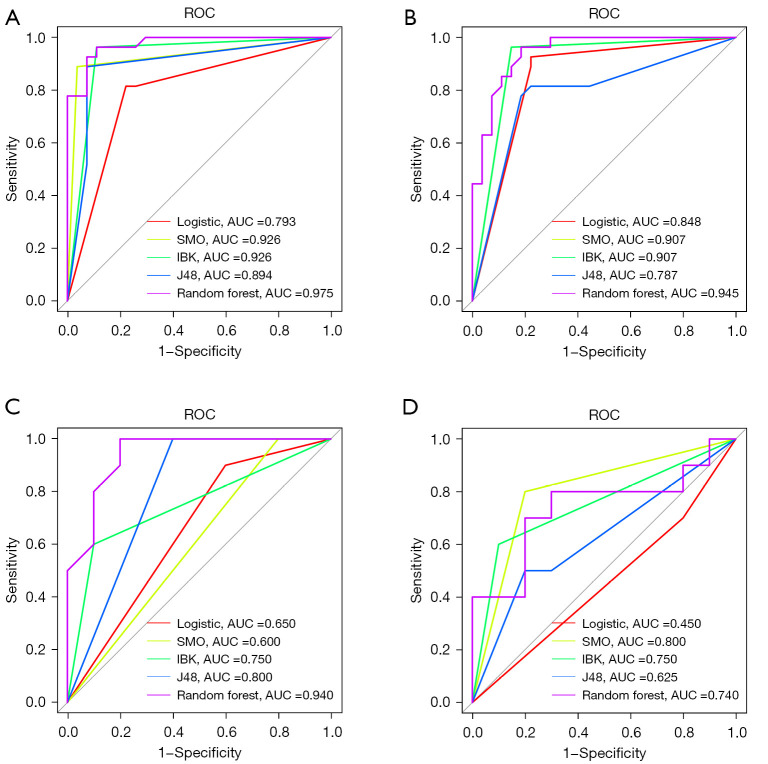
Figure 7.
ROC curve of the hub genes associated with endometriosis, including autophagy-related genes (A) and immune-related genes (B). (B) The yellow line show up because it’s a duplicate of the green and they both have the same result. ROC curve of testing set (GSE7305) genes, including autophagy-related genes (C) and immune-related genes (D). ROC, receiver operating characteristic; AUC, area under the ROC curve; SMO, sequential minimal optimization; lBK, K-nearest neighbours.

