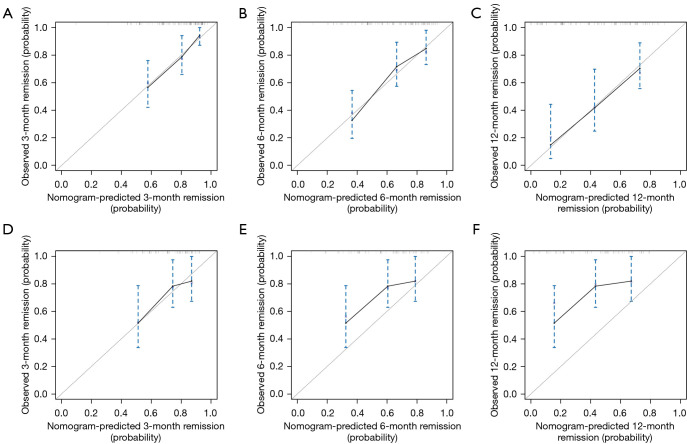
Figure 6.
The calibration curves for predicting RA patients’ postoperative 3, 6, and 12 months remission rate. The calibration curve of the probability of remission rate in development cohort for 3 months (A), 6 months (B) and 12 months (C). The calibration curve of the probability of remission rate in validation cohort for 3 months (D), 6 months (E) and 12 months (F). The x-axis and y-axis represent the nomogram-predicted probability and the actual probability of remission rate, respectively. The perfect prediction would correspond to the slope line that makes a 45° angle. The solid black line represents the actual probability. RA, rheumatoid arthritis.

