Figure 2.

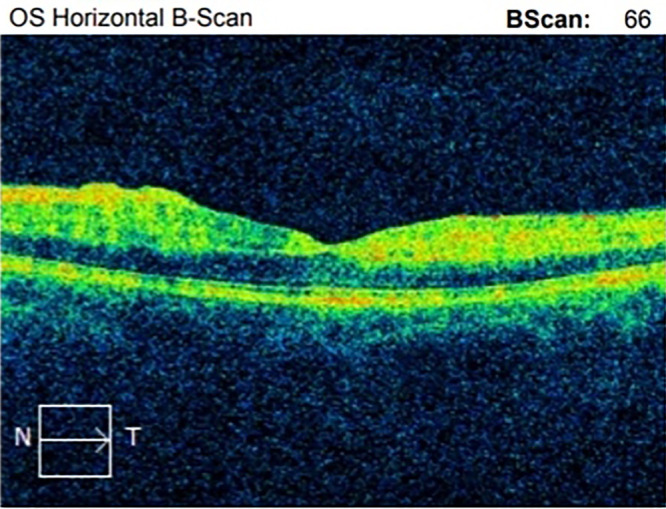
Initial optical coherence tomography (OCT) shows increased foveal thickness in the left eye and areas of disruption of the ellipsoid zone.

Initial optical coherence tomography (OCT) shows increased foveal thickness in the left eye and areas of disruption of the ellipsoid zone.