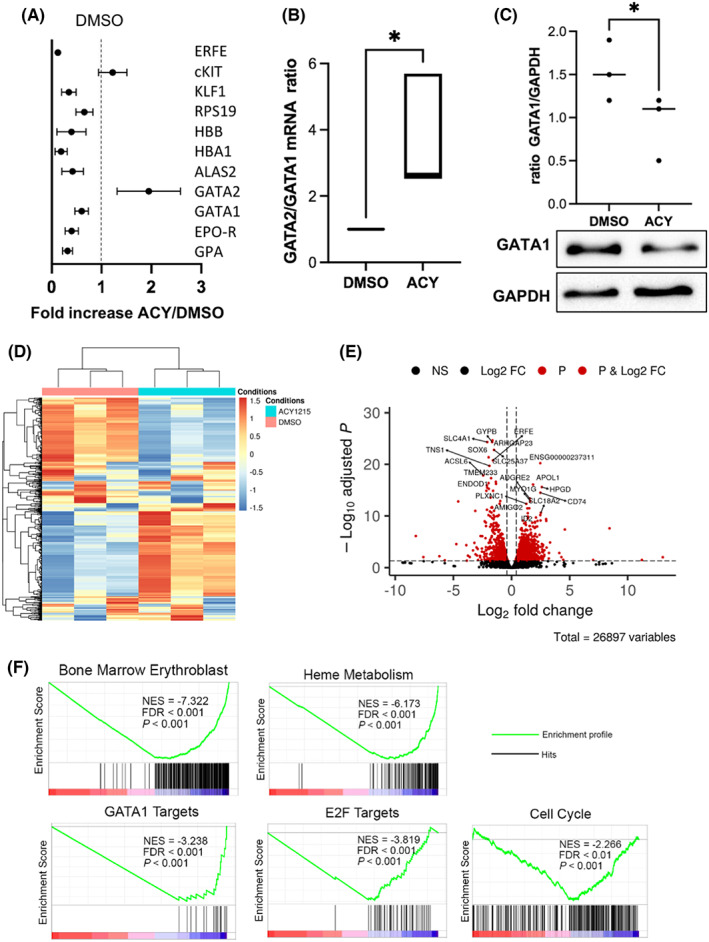
FIGURE 3.

Global transcriptomic modulation induced by HDAC6 inhibition in primary cells. (A) RQ‐PCR showing the differential expression of 11 genes involved during erythroid differentiation between primary erythroid cells exposed to DMSO or ACY‐1215. The figure represents the fold increase in the ACY‐1215 conditions relative to DMSO, n = 4. (B) GATA2/GATA1 ratio at RNA level assessed by RQ‐PCR in primary erythroid cells between the DMSO and the ACY‐1215 conditions, n = 4, p < 0.05. (C) GATA1 decrease at protein level assessed by Western blot in primary erythroid cells exposed to ACY‐1215 comparatively to DMSO as a control, GATA1/GAPDH ratio, DMSO versus ACY: 1.5 (±0.35) versus 0.9 (±0.37), n = 3, p < 0.05. (D) Heat map of Differentially Expressed Genes (DEG) in cells exposed to ACY‐1215 or DMSO (control), n = 3. (E) Volcano plot of the 26,897 identified genes (dots). Genes were considered DEG (red dots) with a Log2 fold change threshold of 1 and an adjusted p‐value threshold of 0.05 with 1170 upregulated and 786 downregulated. (F) Gene Set Enrichment Analysis (GSEA) of DEG showing enrichment for Bone Marrow Erythroblast (Normalized Enrichment Score (NES) = −7.322, False Discovery Rate (FDR) < 0.001, p < 0.001), Heme Metabolism (NES = −6.173, FDR <0.001, p < 0.001), GATA1 Targets (NES = −3.238, FDR <0.001, p < 0.001), E2F Targets (NES = −3.819, FDR <0.001, p < 0.001), Cell Cycle (NES = −2.266, FDR <0.01, p < 0.001).
