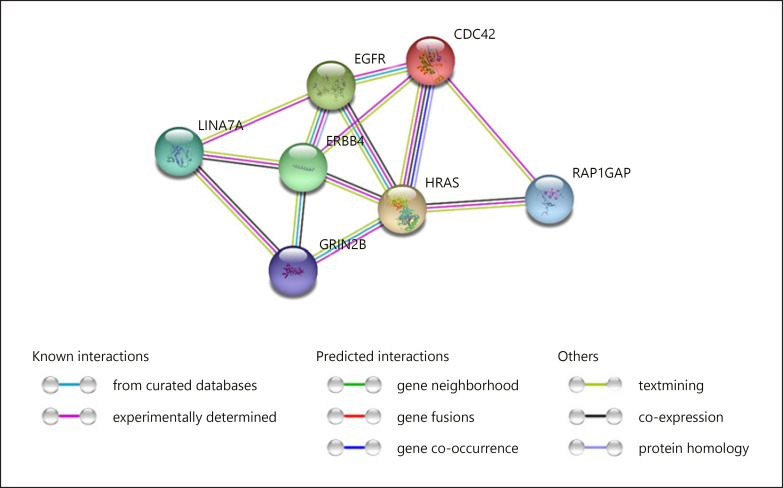
Fig. 6.
Interaction network of genes found strongly dysregulated in the proband and the proteins encoded by candidate genes for language disorders and/or evolution. The network was drawn with String, version 11.0 [Szklarczyk et al., 2015] license-free software (http://string-db.org/), using the molecular action visualization. Colored nodes symbolize genes/proteins included in the query. The color of the lines represents different kind of evidence, as shown in the legend. Stronger associations between proteins are represented by thicker lines. The medium confidence value was 0.0400 (a 40% probability that a predicted link exists in a particular database). The diagram only represents the potential connectivity between the involved proteins, which has to be mapped onto particular biochemical networks, signaling pathways, cellular properties, aspects of neuronal function, or cell types of interest.

