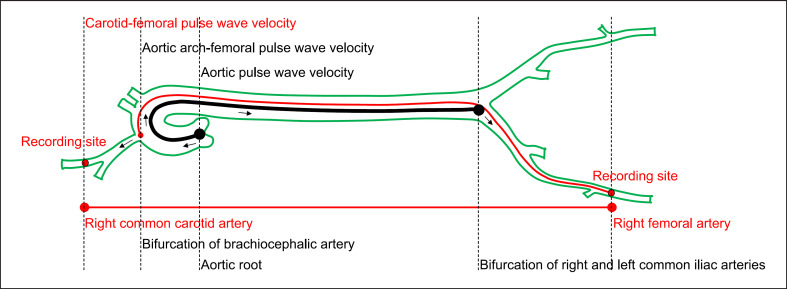
Fig. 4.
Measurement schematic diagram of carotid-femoral pulse wave velocity, aortic arch-femoral pulse wave velocity, and aortic pulse wave velocity. The surface distance between the recording sites of right common carotid artery and right femoral artery is depicted as the straight red line. The path of the pulse wave travelling from the aortic arch (near the bifurcation of the brachiocephalic artery) to the recording site of right femoral artery is depicted as the red curved line. The path of the pulse wave travelling from the aortic root to the end of abdominal aorta (near the bifurcation of the right and left common iliac arteries) is depicted as the thick black curved line.

