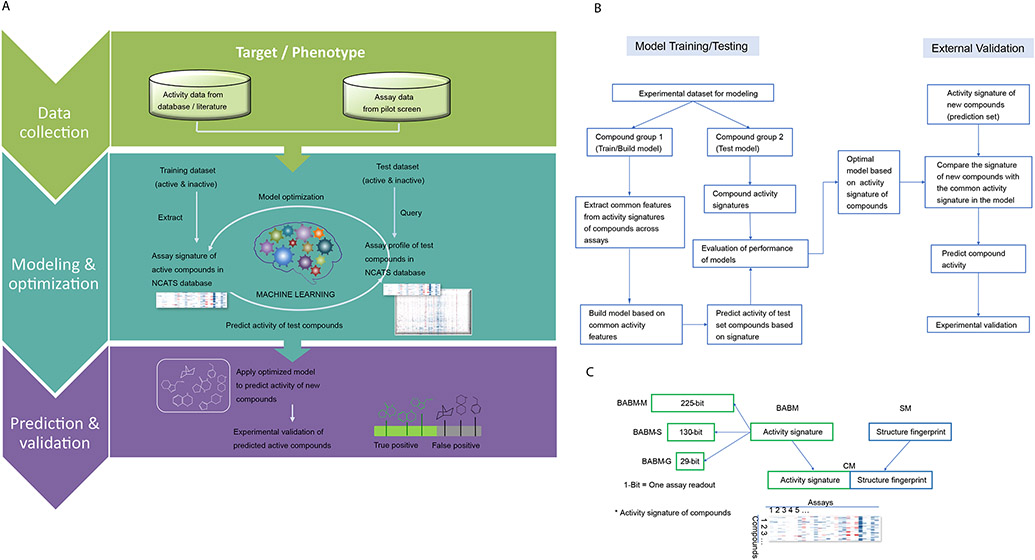
Figure 1.
A. Biological activity-based modeling (BABM) process overview. For any biological target of interest, T (e.g., SARS-CoV-2, ZIKV NS1, EBOV), the model identifies the activity pattern of active vs. inactive compounds based on the training data, which are activity profiles of a set of compounds across a diverse panel of assays including T. The active signature is then matched against the activity profiles of a new set of compounds across the same assay panel. The ability of the model to use this signature to correctly identify actives from the new compound set is first tested using part of the data with known T activity (the test set). An AUC-ROC value is calculated using the test set to evaluate the model performance. The model is then applied to a set of compounds with unknown T activity (prediction set; e.g., Sytravon, MLS, Genesis). Predictions are made on the new compounds based on their activity profile similarity to that of the active signature for T. The predicted T actives are further validated experimentally for their activity against T. Comparing experimental results with model predictions, true positives (TP) and false positives (FP) are counted to determine the performance of the model. In the heat maps, each row represents a compound, each column is an assay, and the heat map is colored by the compound activity. B. Detailed flowchart of the modeling process. C. Types of signatures and fingerprints used in different models.

