. 2023 Jan 3;37(1):57–69. doi: 10.21873/invivo.13054

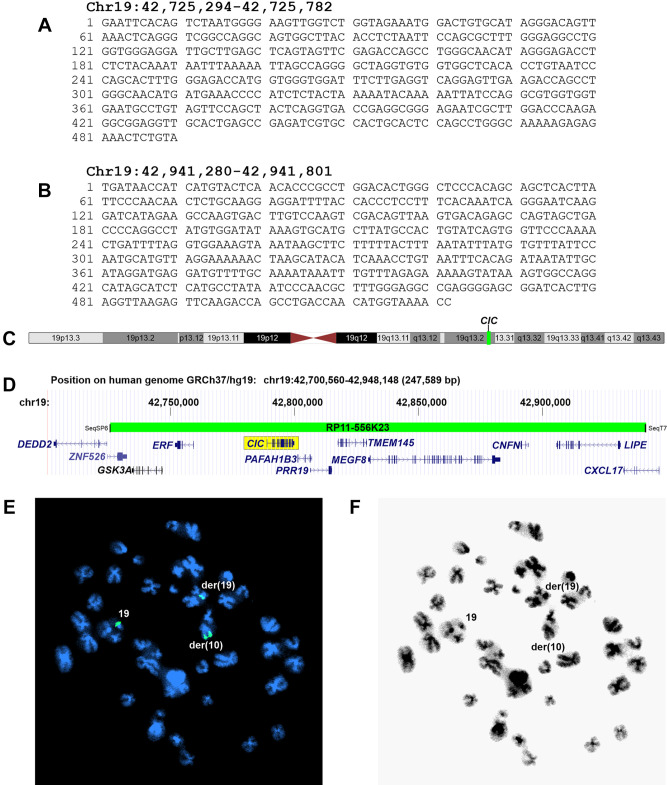
Figure 3. Fluorescence in situ hybridization (FISH) examination of the CIC-sarcoma. (A) Partial sequence of the BAC clone RP11-556K23 using the SP6 primer. (B) Partial sequence of the BAC clone RP11-556K23 using the T7 primer. (C) Ideogram of the chromosome 19 showing the mapping positions of the CIC gene (vertical line) and the BAC clone RP11-556K23 probe (green box). (D) Diagram showing the mapping pattern of the FISH probe RP11-556K23 for the CIC gene. Some neighboring genes in the region are also shown. (E) FISH results on a metaphase spread. Green signals are seen on chromosomes 19, der(10)t(10;19) and der(19)t(10;19). (F) Inverted DAPI staining of the metaphase spread used for FISH experiments.

Figure 3