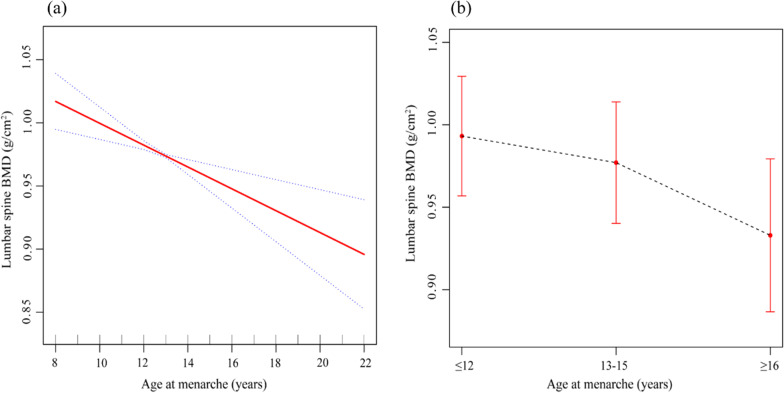
Fig. 2.
Association between age at menarche and lumbar spine BMD. a Menarche age as a continuous variable. The solid red line represents the fitting line between variables, and the dotted blue lines represent the 95% confidence interval. b Menarche age as a categorical variable. The figure shows means and 95% confidence intervals. Age, race, BMI, education level, family PIR, smoking behavior, alcohol consumption, years since menopause, parity, female hormone use, vigorous activities, moderate activities, total calcium, serum phosphorus, arthritis, thyroid disease, liver disease, kidney disease, and diabetes were adjusted for.

