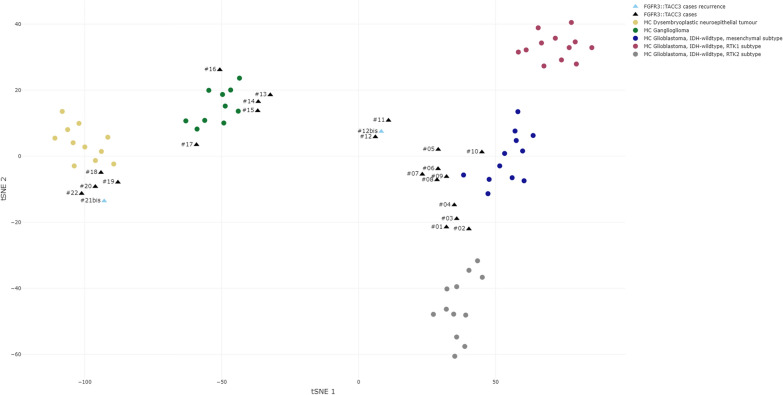
Fig. 3.
t-distributed stochastic neighbor embedding DNA-methylation profiling data analysis. t-SNE analysis of 23 glioma samples with FGFR3::TACC3 fusion (black triangles and blue triangles for recurrences) compared to reference cohort samples retrieved from our DNA-methylation profiling database that were classified by the v12.5 version of the Heidelberg classifier with calibrated scores (CS) > 0.9 as follows: glioblastoma, IDH-wildtype mesenchymal subtype methylation class (MC) (12 cases, blue dots); glioblastoma, IDH-wildtype RTK1 subtype MC (12 cases, purple dots); glioblastoma, IDH-wildtype RTK2 subtype MC (12 cases, grey dots); LGG DNET MC (11 cases, yellow dots); and LGG GG MC (10 cases, green dots)

