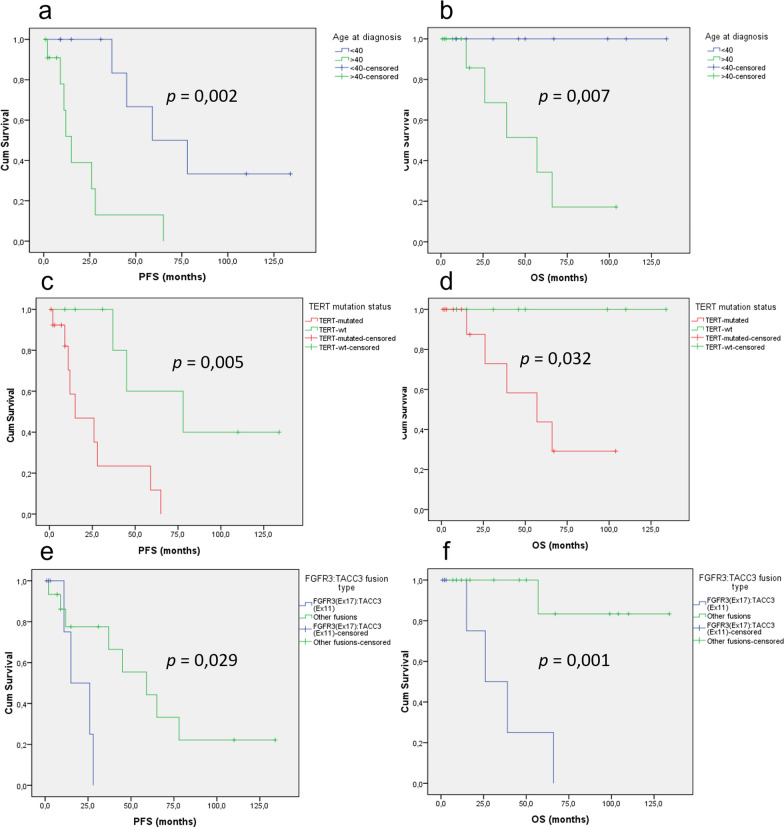
Fig. 5.
Survival analysis according to WHO CNS 5 diagnosis and age at diagnosis. Kaplan-Meier curves for progression-free (a) and overall (b) survival for gliomas with FGFR3:TACC3 fusion according to age at initial diagnosis (> 40 vs. < 40). Kaplan–Meier curves for progression-free (c) and overall (d) survival for gliomas with FGFR3:TACC3 fusion according to TERT promotor mutation status (mutated vs. wild-type). Kaplan–Meier curves for progression-free (e) and overall (f) survival for gliomas with FGFR3:TACC3 fusion according to FGFR3:TACC3 fusion type (FGFR3(Ex17)::TACC3(Ex11) vs. other fusions). OS overall survival, PFS progression-free survival

