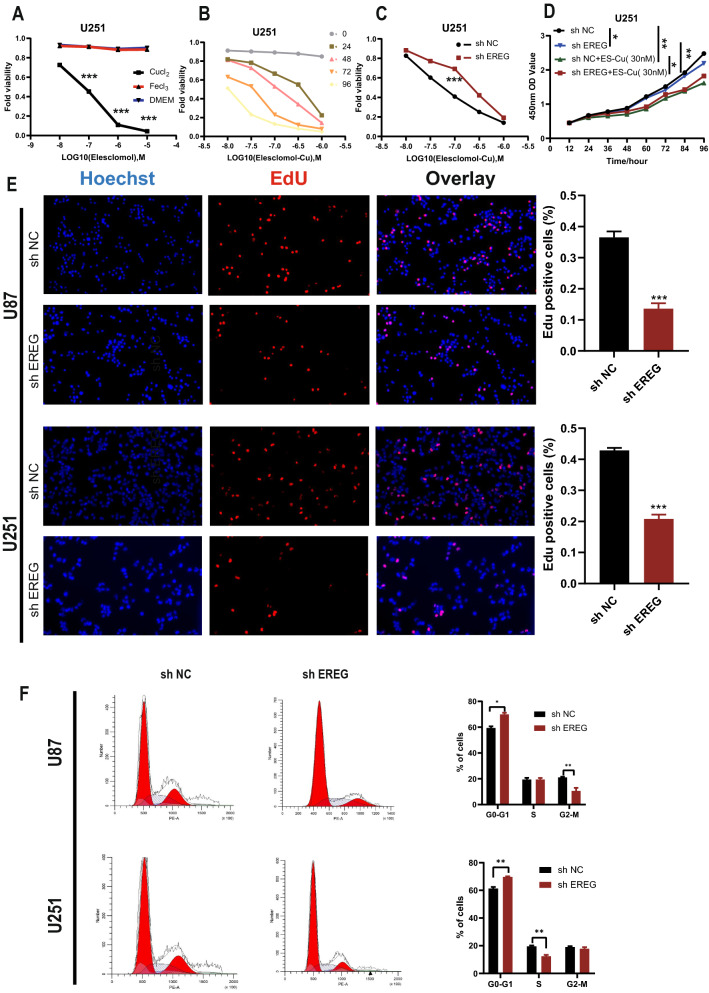
Fig. 7.
EREG proliferation analysis. A Viability of cells (U251) after treatment with elesclomol with or without 10 mM of indicated metals. B V iability of U251 cells was assessed at the indicated times after elesclomol-Cu (1:1 ratio) treatment. ES, elesclomol. (C) Viability of shNC and shEREG in U251 cells was assessed at the indicated times after elesclomol-Cu (1:1 ratio) treatment. ES, elesclomol. D Cell viability of U251 cells after knocking down EREG was determined using CCK8 assays with or without the presence of 20 nM elesclomol-Cu. E U87 and U251 cells were treated with EdU for 6 h prior to click reaction. Data analysis was performed to calculate the signal intensity in EdU-positive cells based on individual DAPI signal and is displayed in the right graph. F Cell cycle distribution was analyzed by PI staining in U251 and U87 cells of shNC and shEREG. *P < 0.05, **P < 0.01, ***P < 0.001. Error bars indicate the mean ± SD

