Fig. 5.
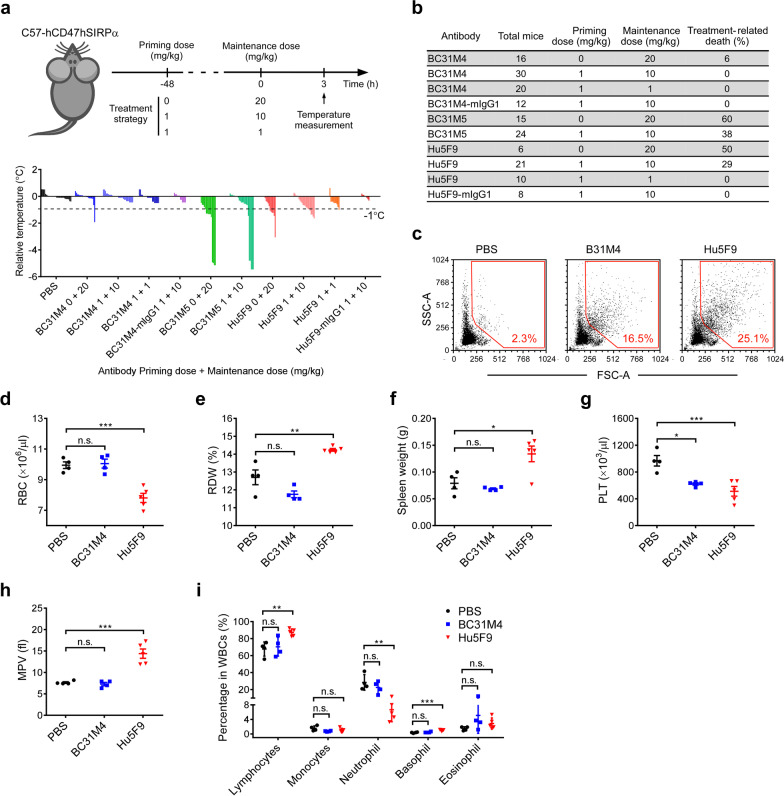
BC31M4 causes minimal hematotoxicity in C57-hCD47/hSIRPα mice. a Top, schematic diagram of mouse treatment and body temperature measurement. ‘0’ indicates no priming dosing. Bottom, body temperature changes compared to the average temperature in the corresponding control group; each histogram represents one mouse. b Summary of the treatment-related-death of the antibody treated mice. c Hemagglutination test of antibodies in vitro. RBC aggregation was analyzed by flow cytometry. Dot plots of the FSC-A and SSC-A values are shown; percentage of events in the gate (red frame) is denoted. d, e, g–i Summary of the complete blood count test of antibody-treated mice. The parameters of RBC count (d), red cell distribution width (e), platelet count (g), mean platelet volume (h), and the proportion of individual leukocytes in WBCs (i) are shown. f Spleen weight of mice used in the complete blood count test. Antibodies used in (a–f) are mIgG2a isotype unless otherwise noted

