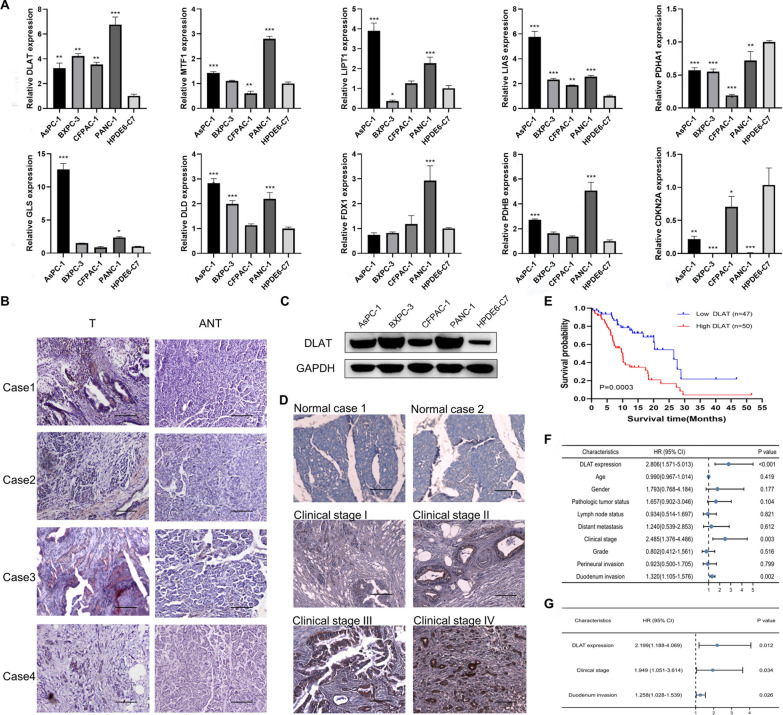
Fig. 10.
Validation of the expression levels of CRGs in cells and tissues. A Comparison of the expression levels of 10 CRGs in pancreatic cancer cell lines and normal cells using qRT‒PCR. *P < 0.05, **P < 0.01, ***P < 0.001. B Comparison of the expression levels of DLAT in PAAD tissues and adjacent nontumorous tissues (ANT) via IHC (scale bar: 100 μm). C Western blot analysis of DLAT protein levels; GAPDH was used as a loading control. D IHC staining indicated that DLAT was overexpressed in PAAD tissues (clinical stages I–IV) compared to in normal pancreatic tissues (scale bar: 100 μm). E Kaplan‒Meier curves of PAAD patients with low versus high expression levels of DLAT. F, G Forest plots for univariate (F) and multivariate (G) Cox regression analyses of the prognostic value

