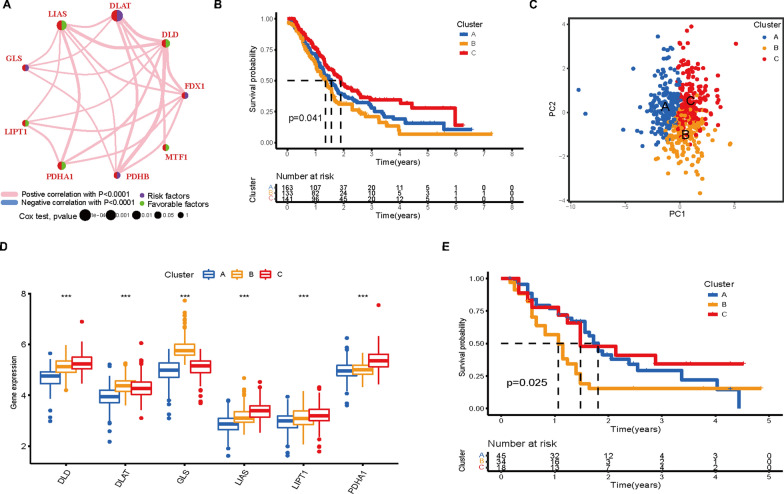
Fig. 3.
Identification of cuproptosis subtypes in PAAD. A Interactions among CRGs in PAAD. The size of the circle represents the impact of each CRG on the prognosis; the P value was evaluated by the log-rank test. Green dots represent protective factors, and violet dots represent risk factors. B Kaplan‒Meier curves of the three cuproptosis subtypes. C PCA identified three distinct subtypes based on the expression levels of CRGs. D Differences in the expression of CRGs among the three cuproptosis subtypes (***P < 0.001). E Survival analysis of the GSE21501 cohort with three cuproptosis subtypes

