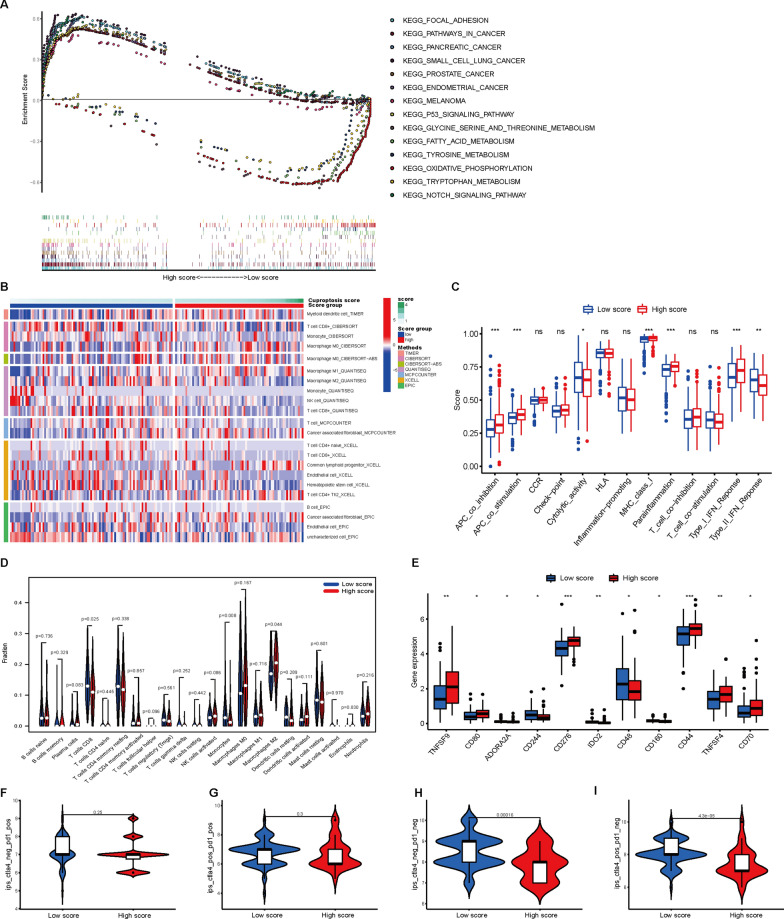
Fig. 8.
Correlations of the cuproptosis score with biological characteristics and immune checkpoints between the two score groups. A GSEA results showing differential enrichment of genes in KEGG between the two groups. B Heatmap for immune responses based on the TIMER, CIBERSORT, CIBERSORT-ABS, QUANTISEQ, MCP-COUNTER, XCELL and EPIC algorithms in the two groups. C Boxplots showing the results for immune function scores using ssGSEA between the two groups. D Violin plot of immune cell infiltration between the low and high cuproptosis score groups. E Expression of immune checkpoints between the two groups. F–I The relationship between the IPS and two cuproptosis score groups in TCGA-PAAD patients. *P < 0.05, **P < 0.01, ***P < 0.001

