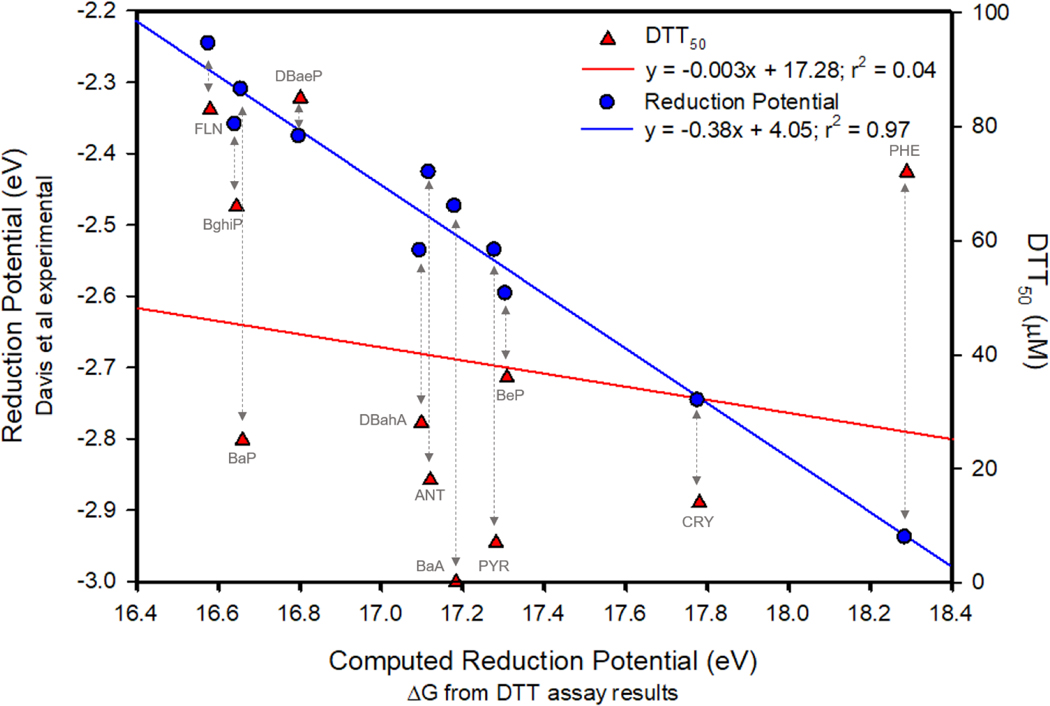
Figure 2.
Comparison plot showing on x-axis the computed ΔG (eV) values for listed PAHs compared to available experimental literature reduction potential values (blue), and DTT50 concentrations (red). Blue circles indicate linear relation (r2 = 0.97) between experimental reduction potential49 of indicated PAHs with the computed reduction potential calculated from the DTT assay results (ΔG eV). Red triangles indicate the DTT50 concentration (μM) compared to the calculated reduction potential are not linearly related (r2 = 0.04).

