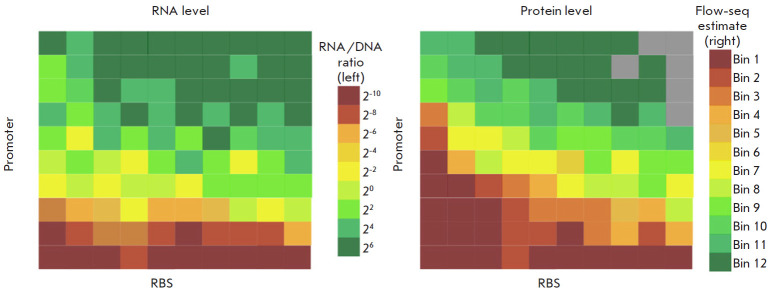
Fig. 4.
A schematic image of the exemplary representative maps of RNA and protein synthesis efficiency levels. RNA (left) and protein (right) levels for a small set of constructs are gridded according to the identity of the promoters (the Y axis) and ribosome binding sites (RBS, the X axis). Promoters and RBSs are sorted in ascending order of the average efficiency of RNA and protein synthesis, respectively. Gray cells indicate constructs corresponding to levels below an empirically defined threshold. Scales of RNA levels (the RNA to DNA ratios) and protein levels (ratios of GFP (green) to RFP (red) fluorescence proteins) are shown to the right of their respective maps. The drawing was executed based on the source [67] in the Inkscape software

