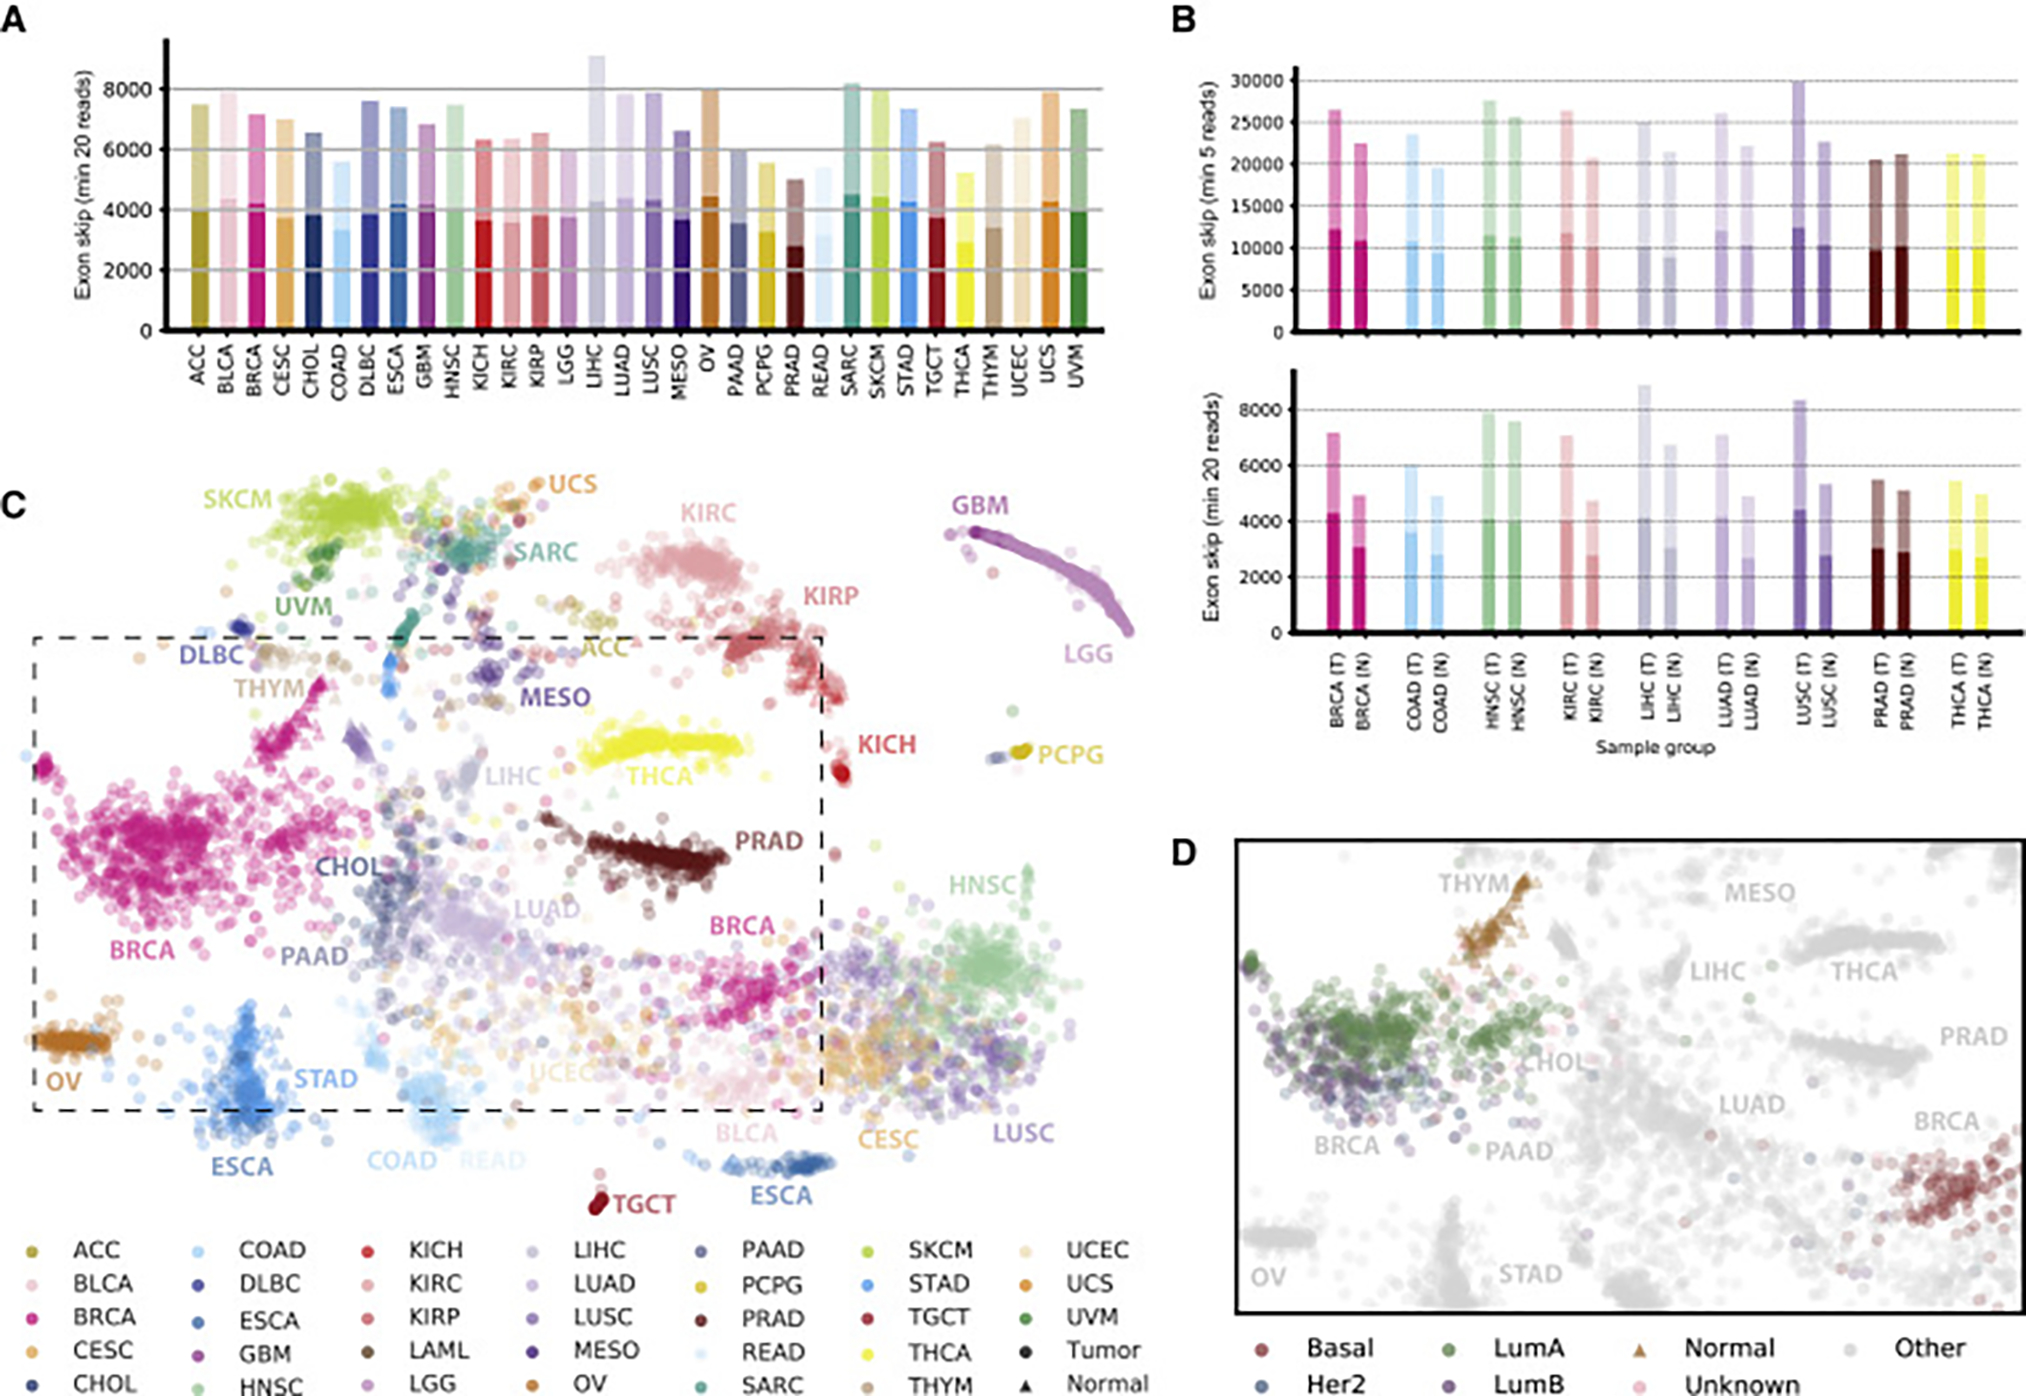
Figure 2. Detection of Tumor Alternative Splicing and Splicing Landscape.

(A) Detection of alternative splicing events. For each cancer type, we considered 40 randomly chosen samples and jointly identified alternative splicing events (exon skipping events are shown) containing junctions that each can be confirmed with a minimum (min) of 20 spliced reads in at least one sample for the respective cancer type. The darker bar fractions correspond to known alternative splicing events and the lighter bar fractions to additional events that are not part of the GENCODE (v19) annotation.
(B) Comparison of the number of alternative splicing events on 40 matched tumor (T) and normal sample (N) pairs for TCGA cancer types with at least 40 normal samples, for events containing junctions confirmed with at least five reads (top) or 20 reads (bottom) in the respective cancer type.
(C) Landscape of alternative splicing for all considered TCGA samples computed on exon skipping PSI scores only. Each point represents a sample, colored according to its TCGA project code. The position of each sample is computed as a t-distributed stochastic neighbor embedding (t-SNE) representation of the higher-dimensional splice event PSI matrix. Tumor samples are shown as circles and normal samples as triangles. The dashed box represents an area detailed in (D).
(D) Samples in the splicing landscape highlighted for subtypes of BRCA. Normal samples are shown as triangles and tumor samples as circles colored according to subtype. Samples of all other cancer types are shown in gray.
